


| Amicus | |
| Sale Item Price Variance Report | |
| See Also Submit feedback on this topic | |
| Reports > Sales Reports > Sale Item Price Variance Report |
Glossary Item Box
The Sale Item Price Variance Report allows you to view sales where the sell price of the product was different from the recommended retail price (RRP). This allows you to quickly and easily view any of the sales made where a discount has been applied.
Click Reports on the Main Menu, followed by Sales Reports then Sale Item Price Variance Report option. Alternatively, click Sales on the Toolbar followed by Reports, Sales Reports then Sale Item Price Variance Report option.
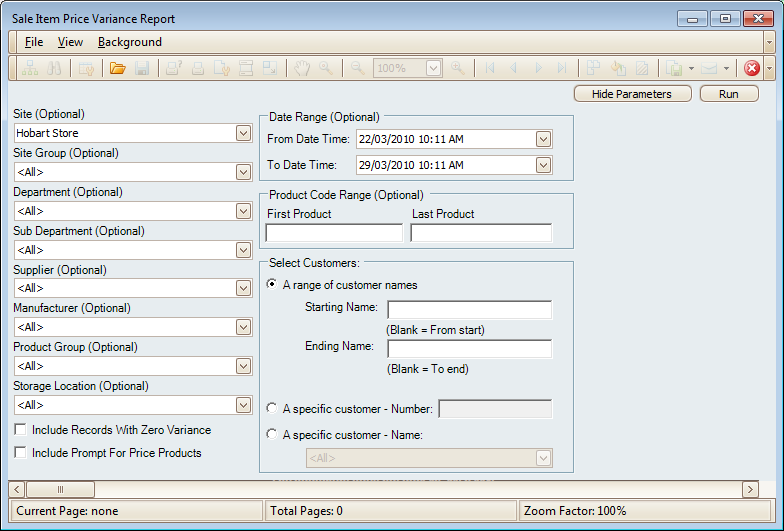
There are many options availible to you so that you can filter the results based on your preferences. These options include: Site (Optional), Department(Optional), Sub-Department (Optional), Supplier (Optional), Manufacturer (Optional), Product Group (Optional), Storage Location (Optional).
You can also filter the report to only include sales within a specified Date Range (Optional) and/or Product Code Range (Optional).
This report also allows you filter the sales to only show sales based on the variables you place in the Select Customers filter. To select from a range of customers, click on the A range of customer names checkbox (this will be selected by default) and enter their Starting Name and/or Ending Name (leaving both these boxes blank will show all of the customer sales). You can also filter the report to only show the sales of a specific customer by clicking on A specific customer - Number checkbox and then enter in the customers number. Alternatively, you can enter the customers name by clicking on A specific customer - Name checkbox and then select the customer name from the dropdown list.
If you would like to include records with No difference between the Recommended Retail Price and the Sell Price.',event)">zero variance then click on the Include Records With Zero Variance checkbox. To include products that are prompted for a price then click on the Include Prompt For Price Products.
Once you have entered your variables into the filter, click on the Run button (located at the top right hand side of the screen) and this will then produce the Sale Item Price Variance Report based on your filters.
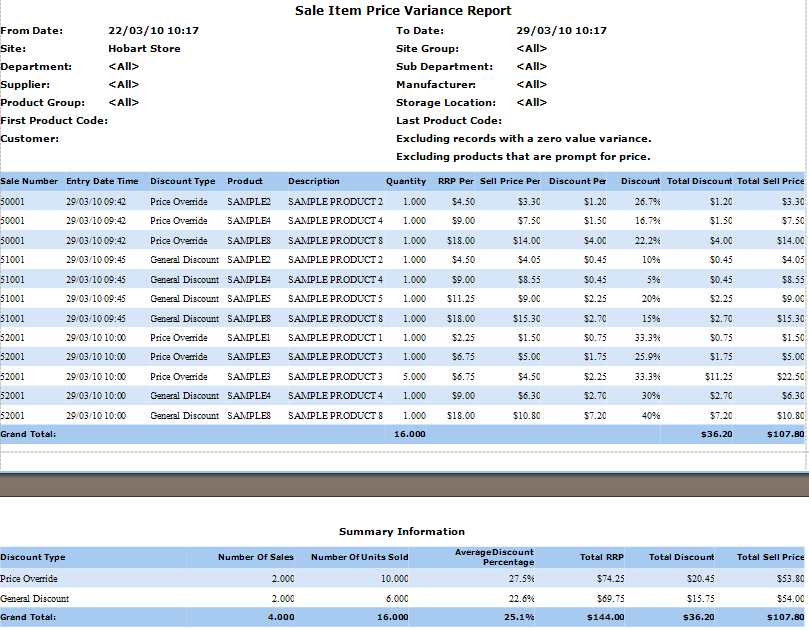
The top of the Sale Item Price Variance Report will show all of the filters that have been used in producing the report. These include: From, To, Site, Department, Sub-Department, Supplier, Manufacturer, Product Group, Storage Location, First / Last Product Code and Customers.
Details
The primary information in this report includes: Sale Number, Entry date time, Discount type, Products, Description, Quantity, RRP Per, Sell Price, Discount Per, Discount, Total Discount and Total Sell Price.
At the end of the main report there is a Grand Total row which shows the total Quantity of the goods sold as well as a grand total of the Total Discount column. The Total Sell Price is also added up and included on the grand total row.
Summary Information
At the bottom of the Sale Item Price Variance Report is the Summary Information. The summary information contains a condensed version of the report above it.
This includes the Discount Types, Number Of Sales, Number Of Units Sold, Average Discount Percentage, RRP column for each Discount Type.',event)">Total RRP, Discount Types total discount columns.',event)">Total Discount and the Total Sell Price.
The Grand Total row in the Summary Information totals up each of the columns.
See Also
Amicus Reports GuideProduct by Sale Item Price Variance Report