


| Amicus | |
| Product Stock Movements Report | |
| Submit feedback on this topic | |
| Reports > Product Reports > Product Stock Movements Report |
Glossary Item Box
The Product Stock Movements Report details the net stock transactions from the time of the opening date (as opening stock) to the end date (closing stock).
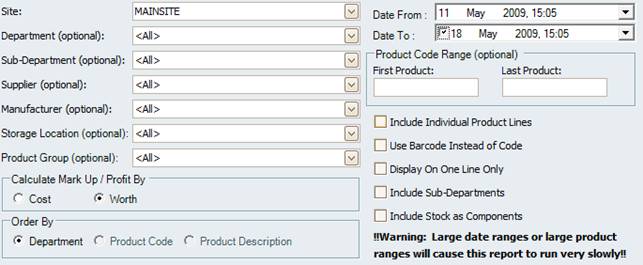
Figure : Product Stock Movements Report options
Options
Select the Date From, Date To, Site, Department, Sub-Department, Storage Location, Manufacturer, Product Group, Supplier, Product Code Range, select how the Mark Up and Profit columns are calculated by, how the results are Order By, either by Department, Product code or Product Description.
The report can also Include Sub-Departments, Include Stock as Components, Include Individual Product Lines, Use Barcode Instead of Code and Display On One line Only for easy exporting.
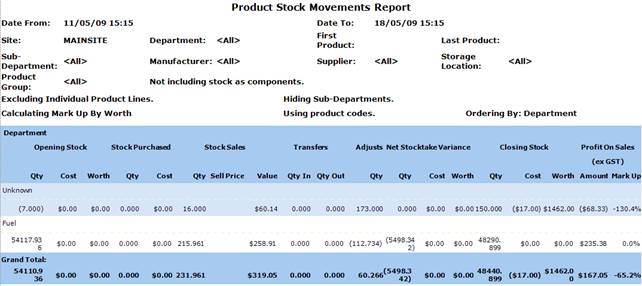
Figure : Product Stock Movements sample report
Filter
The filters listed on the report include; Date From, Date To, Site, Department, Sub-Department, Storage Location, Manufacturer, Product Group, Supplier, First / Last Product.
Details
The product transactions are grouped by Department and are listed by; Opening Stock Qty/
Cost is the price of the item when recieved from the supplier and input a stock receipt in to amicus.
i.e. you recieve x items for $3 and input a stock reciept for that amount. The cost at sale is $3 per item.
',event)">Cost/Worth, Stock Purchased Qty/Cost, Stock Sales Qty/Sell/Price/Value, Transfers Qty In/Out, Adjustment Qty, Net Stocktake variance Qty/Cost/Worth, Closing Stock Qty/Cost/Worth and Profit On Sales (ex GST) Amount/Mark Up.