Product Significance Report
From Amicus


| Amicus | |
| Product Significance Report | |
| See Also Submit feedback on this topic | |
| Reports > Sales Reports > Product Significance Report |
Glossary Item Box
This report gives details of the products which retain the highest product turnover. The report summarises comparisons of number of items sold against value and profit gained, in addition the margins are given in a graphical representation.
Click Reports on the Main Menu, followed by Product Reports then Product Significance Report option. Alternatively, click Products on the Toolbar followed by Reports, Product Reports then Product Significance Report option.
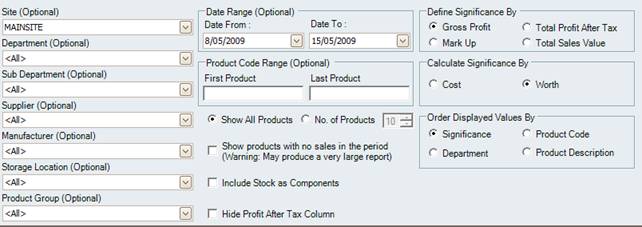
Figure : Product Significance Report options
Options
The reports available options include; Department (Optional), Supplier (Optional), Sub-Department (Optional), Manufacturer (Optional), Product Group (Optional), Storage Location (Optional), Site (Optional), Date Range (Optional), Product Code Range (Optional), Select Show All Products / No. Of Products to choose how many to list in the report.
Ordered Display Values By allows you to select the order of products, ether by the highest turnover (Significance) or alpha-numerical by Department containing the products, product code or product name. Check Show products with no sales and purchases in the period to include all products which have no sales or purchases in the transaction period. Additional options include
Allows the stock that is a component sof another to be marked in the report.
',event)">Include Stock as Components,Hide/Show the desired column.
',event)">Hide Profit After Tax Column, Calculate Significance By, Define Significance By.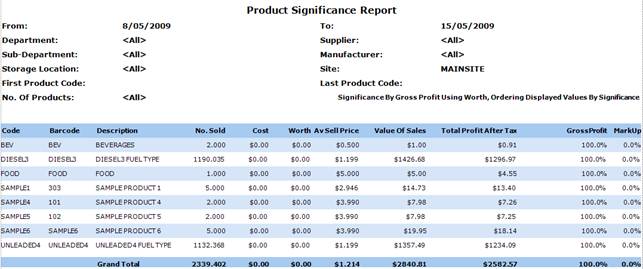
Figure : Product Significance Report sample report – table of figures
Filters
The reports displayed filters include; From, To, Department, Manufacturer, Sub-Department, Supplier, Storage Location, First / Last Product Code and Site, No. Of Products, Ordered By.
Details
The products are listed by Code, Barcode, Description, No. Sold, Cost, Worth, Av sell Price, Value of Sales before tax, Total Profit After Tax, Gross Profit before Tax, and the price Mark Up as a percentage.
In addition to the table, the PIE chart shows a graphical comparison of the most significant products. The graph below show that roughly 2 thirds more Beverages are sold than Designer Bags.
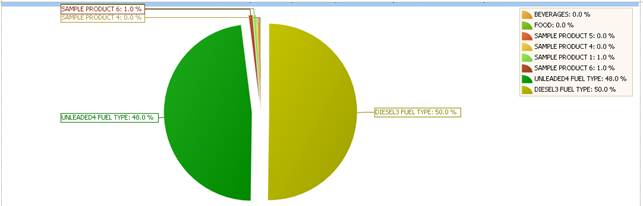
Figure : Product Significance Report sample report - graph