Debug Pane
From Oracle Insurance Rules Palette
Debug Pane
The Debug pane is a tool that can be used to debug errors in the math section of a policy- or client-level transaction. This tool moves through execution steps in sequence, and displays all math variables and their associated values at each step. Debugging not only walks through the transaction’s configuration, but automatically opens any called functions, steps through all of the math variables and displays values according to what was passed in from the transaction configuration.
Before Using Debug
Before using the debug feature, make sure remote debugging is set up in the Rules Palette.
Steps to Check Remote Debugging in Rules Palette
-
Right-click on the environment connection in the Main Explorer tab.
-
Select Properties. The Properties Window will open.
-
Scroll down to the row for the Debug Web Service URL.
-
Click the button to the right of the field. An Environment Properties window will open for the Debug Web Service. The URL should be listed.
Start and Run a Debug Session
Debug functionality is available for transactions at both the policy level and the client level.
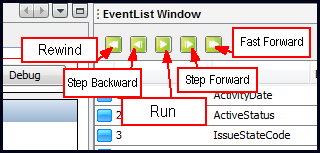
The methods for debugging the configuration are as follows. The buttons for these functions are located at the top of the EventList Window.
- Run: Ignore all breakpoints and process the entire transaction.
- Step Forward: Advance through the configuration one line at a time. On advancing, the line advanced to will be calculated and displayed. The Step Forward will step into and out of CopyBooks and Functions, as determined by the configuration.
- Fast Forward: Advance through the configuration to the next breakpoint. The debugger will stop on the line where the breakpoint is checked. Breakpoints may be placed in CopyBooks and Functions. If no breakpoints are set, the debugger will process the entire transaction.
- Step Backward: Step back one line in the configuration. This will “undo” or “clear” the step that was just performed, and take the user to the previous step, calculating and displaying that step as if the one that occurred after it was never determined.
- Rewind: Return to the beginning of the configuration, allowing the user to start debugging over. All prior values calculated and displayed will be cleared, with the exception of the input values.
Buttons Available in the Debug Pane
To start a debug session for a client-level transaction:
- Open the transaction in the Rules Palette. Make sure the transaction is checked in.
- Go into the OIPA application and search for a client. Once the client is found, open the client record.
- Add the client transaction to the client. This can be done by clicking the Add Activity link on the Secondary menu and searching for the client transaction. When found, select it and click Add.
- Leave the activity (transaction) in a pending status.
- Go back to the Rules Palette and click the Debug pane in the transaction.
- Click the drop-down box next to Client and select the client where you just added the activity (transaction).
- If the client is not listed, click the Search button to the right of the Client field. Select a client type from the drop-down box. Then enter any search criteria. The % sign can be used as a wildcard, but it cannot be the only value in a search field.
- If the transaction is listed multiple times for the client in OIPA, then the Activity Date drop down will populate according to effective date, with the most recent one at the top of the list.
- Click the Debug button at the top of the window. It will take a few minutes for the debugger to load. When complete, a message will appear indicating that the session loaded successfully.
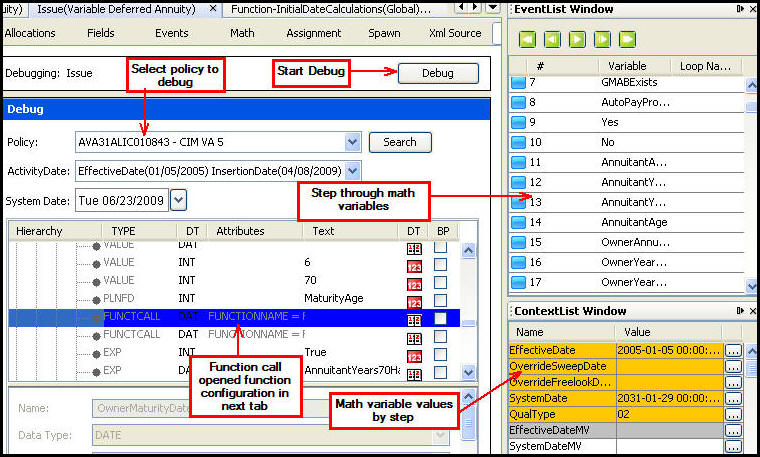
- Initiate the debug session by using one of the methods described above. The EventList Window steps through the math variables, highlighting the variable currently being processed, and the ContextList Window displays the current state of each variable throughout the debug session.
All translation, compilation and runtime errors must first be fixed in order to use the Debug pane. Debug can be performed when the transaction is checked-in or checked-out; however, configuration problems can only be fixed if the transaction is checked out.
To start a debug session for a policy-level transaction:
- Open the transaction in the Rules Palette. Make sure the transaction is checked in.
- Go into the OIPA application and search for a policy. Once the policy is found, open the policy record.
- Add the transaction to the policy. This can be done by clicking the Add Activity link on the Secondary menu and searching for the transaction. When found, select it and click Add.
- Leave the activity (transaction) in a pending status.
- Go back to the Rules Palette and click the Debug pane in the transaction.
- Click the drop-down box next to Policy and select the policy where you just added the activity (transaction).
- If the policy is not listed, click the Search button to the right of the Policy field, then enter any search criteria. The % sign can be used as a wildcard, but it cannot be the only value in a search field.
- Click the Debug button at the top of the window. It will take a few minutes for the debugger to load. When complete, a message will appear indicating that the session loaded successfully.
- Initiate the debug session by using one of the methods described above. The EventList Window steps through the math variables, highlighting the variable currently being processed, and the ContextList Window displays the current state of each variable throughout the debug session.
All translation, compilation and runtime errors must first be fixed in order to use the Debug pane. Debug can be performed when the transaction is checked in or checked out; however, configuration problems can only be fixed if the transaction is checked out.
Debug Pane and Related Windows
EventList Window
In the EventList Window, a blue ![]() or green
or green ![]() button appears next
to the math variable execution steps. The blue
button indicates the math variable is part of the transaction. The
green button indicates the math variable is part of a called function.
Double-click on either button to be brought to
the math variable in the transaction or function configuration.
button appears next
to the math variable execution steps. The blue
button indicates the math variable is part of the transaction. The
green button indicates the math variable is part of a called function.
Double-click on either button to be brought to
the math variable in the transaction or function configuration.
The remote debugger does not debug Function rules separately, only as called within a transaction.
ContextList Window
Use the
ContextList Window to view the state of the math variable at each step
in the debug session. If the value does not fully
display in the column, click the ellipsis (...) button to see the full
details. When a Valuation element is debugged, a dollar sign icon![]() is available instead of the ellipsis button. Clicking it will open a Policy Valuation window that displays valuation and fund information.
is available instead of the ellipsis button. Clicking it will open a Policy Valuation window that displays valuation and fund information.
Note: To clear all values in the ContextList Window and restart debugging, click the Rewind button at the top of the EventList Window.
The Debugger will not display the values of MathUpdate math variables or the field itself.
Breakpoints
Another debugging feature is the ability to set-up breakpoint(s) in
the configuration. Breakpoints are places in the code where execution
is stopped for debugging purposes. In the Rules
Palette, select as many breakpoints as needed by checking the BP checkbox.
After breakpoints are selected, use the Run button
![]() in EventList window to step through configuration.
in EventList window to step through configuration.
Important: Breakpoints
can be set for a loop that then displays math variables and associated
values for each iteration of the loop. Use the Run button ![]() to step through each iteration of a loop.
to step through each iteration of a loop.
Breakpoint Column on Debug Pane
To clear all the breakpoints, select the Clear All ![]() button.
button.