You create total fields to summarize data from other fields in the source data. For example, if the datasheet or form has a Sales field that records the amount of each individual sale, a Sum of Sales total field could add up the sales figures for each category, or a Count of Sales total field could tally the number of sales for each category. You can also create a total field that uses an expression.
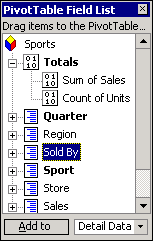
In the field list, the total fields are displayed at the top, under Totals. The Sum of Sales and Count of Units fields are available for inclusion in the PivotTable view as total fields.

For example, in the following PivotTable view, the Sum of Sales total field has been added to the detail area to display summary data for each sport and quarter.

 The Sum of Sales total field.
You cannot add total fields to the row, column, or filter area.
A total field uses a summary function, such as Sum or Count. Depending on the type of source data, you can also use more than one summary function to summarize the data in the same field by adding more total fields, each using a different summary function.
You can also add a calculated total field that uses an expression. For example, to see the year-to-date sales figures, you could create a total field that uses the following expression:
Sum (YTD(), [Measures].[Sales])
The following PivotTable view shows sales and year-to-date sales figures.

 Changing the orientation of total fields
You can change the orientation of total fields in the PivotTable view. Displaying the fields in the row orientation lists them down the first column to the right of the row fields. Displaying them in the column orientation lists them across the first row below the column fields.
 Showing total values as percentages
You can also show total values as a percentage of a row, column, or grand total, or as a total of the item's parent in the row or column axis.

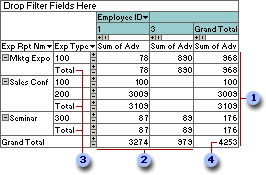
 These values will be used if you choose to show total values as a percentage of row total.
 These values will be used if you choose to show total values as a percentage of column total.
 These values will be used if you choose to show total values as a percentage of the total of the item's parent in the row axis.
 This value will be used if you choose to show total values as a percentage of the grand total.
You can display subtotals for any row or column field in the PivotTable view if the view includes at least one total field and more than one row field or more than one column field. If you choose to display subtotals for a field, grand totals are also selected for display, and subtotals and grand totals are displayed for every total field in the PivotTable view where the field intersects the row or column field you select.
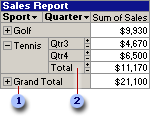
In the following example, subtotals and grand totals are displayed for both row fields using the values in the Sum of Sales total field.

 Grand total
 Subtotal
When subtotals and grand totals are displayed for the Sport and Quarter fields, the PivotTable view includes subtotals for the Quarter field and a grand total for the Sport field.
If you move a field for which subtotals or grand totals are displayed out of the row or column area, the subtotals or grand totals become hidden, but the setting is retained. The subtotals or grand totals are redisplayed if you move the field back to the row or column area.
When you hide subtotals and grand totals for a field, they remain hidden regardless of where you move the field, even if you remove the field from the PivotTable view and later add it back.
Depending on the type of data you're viewing in the PivotTable view, you might want subtotals and grand totals to include or omit the values for items of data you've hidden by filtering. You can specify that all subtotals and grand totals either include or exclude any hidden data.