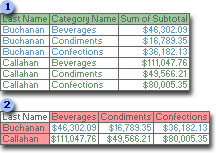
You can use a crosstab query to calculate and restructure data for easier analysis. Crosstab queries calculate a sum, average, count, or other type of total for data that is grouped by two types of information

 A select query
 A crosstab query based on the select query
 Add a PivotTable list to a data access page
A PivotTable list is an interactive table that you can use to analyze data dynamically from within a Web browser. At run time, users can change the layout of the PivotTable list. They can move the fields that are displayed in the row, column, and data area of the PivotTable list, or add or remove fields from the list. Users can also filter, sort, and group data.
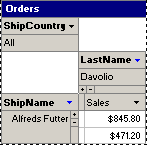
The following illustration shows a PivotTable list on the Orders data access page.

 View a datasheet or form in PivotTable view
Access 2002 or later provides a PivotTable view for datasheets and forms. In this view, you can build an interactive report using the fields underlying the datasheet or form. The view uses a Microsoft Office PivotTable Component, so you can do all the things that you can do on a PivotTable list. You can add fields to the view, move or remove fields, and filter, sort, and group data.
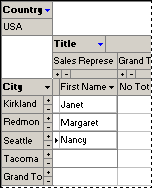
The following illustration shows the Employees table in PivotTable view.
