Filter By Selection, Filter By Form, and Filter For Input are different ways to filter records in a form or datasheet.
-
If you can easily find and select the value you want the filtered records to contain, use Filter By Selection.
-
If you want to choose the values you're searching for from a list without scrolling through all the records, or if you want to specify multiple criteria at once, use Filter By Form.
-
If the focus is in a field and you just want to type in place the exact value you're searching for or the expression whose result you want to use as your criteria, or if you want to specify multiple criteria at once, use Filter For Input.
For complex filters, use Advanced Filter/Sort. You can:
-
Search for records that meet multiple criteria.
-
Search for records that meet one criteria or another criteria.
-
Enter expressions as criteria.
Note After specifying the values you're searching for by using Filter By Selection, Filter By Form, or Filter For Input, you can switch to the Advanced Filter/Sort window to see how the values you specified are translated into a criteria expression in the design grid.
 Similarities and differences between select queries and filters
The basic similarity between select queries and filters is that they:
- Both retrieve a subset of records from an underlying table or query.
- Produce results that can be used as the source of data for a form or report.
- Can sort records.
- In general, enable you to edit data if editing is otherwise allowed. (You can also perform bulk updates with an update query.)
How you want to use the records that are returned determines whether you use a filter or a query.
Generally, use a filter to temporarily view or edit a subset of records while you're in a form or datasheet. Use a query if you want to do any or all of the following:
- View the subset of records without first opening a specific table or form.
- Choose the tables containing the records you want to work with and add more tables at a later date if necessary.
- Control which fields from the subset of records display in the results.
- Perform calculations on values in fields.
Note Even if you determine you need a query, consider taking advantage of the easy Filter By Form, Filter By Selection, or Filter For Input techniques for creating a filter, and then saving the filter as a query. This enables you to bypass the query's design grid altogether (unless you want to make additional changes to the query). Even so, when you open the query in Design view, you'll see how Microsoft Access filled in the design grid using the information from the filter. You can then use this information as a guide for making additional changes.
 How filters are saved for reuse
The way filters are saved after they are created or applied varies depending on the object.
- When you save a table or form, Microsoft Access saves the filters you created. You can reapply the filters when you need them, the next time you open the table or form.
- When you save a query, Access saves the filters you created, but it does not add the filter criteria to the query design grid. You can reapply the filters after you run the query, the next time you open it.
- If you created a filter on a subform or subdatasheet, this filter is also available when you open the form or table for the subform or subdatasheet independently.
- In a report, you can't create a filter by using the filtering techniques mentioned previously. However, a report or form can inherit a filter.
 How a filter and sort order for a table or query affect new forms or reports
When you create a form or report based on a table or query that has a filter or a sort order specified in it, Microsoft Access includes the filter and sort order with the form or report. The sort order is automatically applied. Whether or not the filter is automatically applied depends on how you create the form or report.
- If you create the form or report directly from filtered data while the data is displayed in an open table or query, the filter is applied automatically each time you view the report, but it is applied only the first time you view the form after creating it. (The next time you open the form, you'll apply the filter yourself.)
- If you create the form or report based on a closed table or query, the filter won't be applied in the new form or report. You apply it when you need it.
 Ways to filter records for a data access page
 Ways to filter records before they are retrieved from the database
Filtering records before they are retrieved from the database can improve data access page performance because there are fewer records to download from the underlying database.
-
You can base your page on a query that includes criteria (search conditions) to limit the records.
-
In a Microsoft Access database you can define a server-side filter in the ServerFilter property of the RecordsetDef object, or by using the Filter property in Visual Basic for Applications (VBA) or Microsoft Visual Basic Scripting Edition (VBScript). In a Microsoft Access project you can define a server-side filter in the ServerFilter property in VBA or VBScript.
-
On a grouped data access page, you can create a filter that retrieves data for a specific group, such as orders for a specific customer. The data access page won't display any records until you choose the group from a drop-down list in Page view or Microsoft Internet Explorer. Once you choose the group, the filter is applied and only those records are retrieved.
On an ungrouped data access page, you can create a filter by designating a field as the filter field. When you choose a value from the filter field, all records that contain the selected value are retrieved.
-
In Design view, you can add a server-side filter to a hyperlink on a page. Then, when you click the link in Page view or in the browser, only the records specified in the filter are displayed on the page you jump to.
 Ways to filter records after they are retrieved from the database
 About filtering data in a PivotTable or PivotChart view
 About filtering data in a PivotTable view
You can use the filter feature to find specific data values or all data that matches a value.
Filtering a field (Autofiltering) You can filter fields in the row, column, and detail areas. When you filter a field, you select one or more items of data in the field that you want to view, and hide the other items.

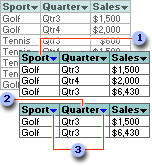
 First, the Sport field is filtered to display only Golf sales ...
 ... and then the Quarter field is filtered to display only Golf sales in Qtr3.
 When you filter a field, the drop-down arrow
  for the filtered field changes to blue instead of black, and the AutoFilter button
  on the toolbar is selected.
Filtering a field is particularly helpful when you have a large amount of source data but you want to focus on specific areas. When you filter a field, you can display the data for a single item, or you can select some items to display and other items to hide. You can filter on more than one field at a time to further narrow the focus.
Filtering based on the data in one cell (Filter by Selection) You can filter a field to display only data that matches the value in a selected cell. Filtering by selection is particularly useful for fields in the detail area, when you want to view all of the rows that contain a particular value.
Using a field in the Filter axis You can also filter data by using filter fields. When you select one or more items in the filter field, the data that's displayed and calculated in the entire PivotTable view changes to reflect those items. You can add new filter fields or move existing fields to the filter area.

 Filter field
Conditional filtering You can apply a filter to a row or column field to show the top or bottom n items based on a total. For example, you can filter for the three cities that generated the most sales or the five products that are least profitable. Instead of n items, you can also choose to filter for a certain percentage of items. For example, you can filter for the top or bottom 25% of salespeople based on the number of orders handled. If there are 40 salespeople, after the filter is applied, you will see data for 10 people.
-
Filters are additive. Each filter you apply is added to the ones you already have in effect. However, when you apply a filter by selection, the conditional filter already applied on the field is removed before the filter by selection is applied.
-
Conditional filters are independent of each other. The result of one conditional filter does not affect the result of another.
-
An autofilter is always applied before a conditional filter, regardless of the order in which you applied them. For example, if you set a conditional filter to show the top two cities based on sales, followed by an autofilter on the ShippedCity field to include only five cities, the PivotTable view will show the top two of the five cities you selected.
 Removing and reapplying a filter
You can display all data for all fields by turning off autofiltering. However, the filter settings are retained, so that when you turn autofiltering back on, the data that was previously displayed or hidden is again displayed or hidden.
Filter settings are retained when you move fields to change the layout. Also, if you remove a field and later add the field back to the layout, the same items are again hidden.
If you don't want to retain your filter selections, make sure the AutoFilter button  is not selected before you start selecting items to filter. If the button is not selected, selecting new items to filter automatically turns filtering on and removes your former filter settings.
 Identifying filters that are currently in effect
-
When items in a field are hidden by autofiltering or filter by selection, the drop-down arrow
 in the field label is blue. Click the blue arrow
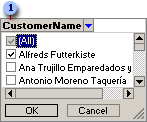
  to see the filter that is in effect.
 -
When items in a field are hidden by conditional filtering, a funnel
 appears to the left of the drop-down arrow
  . You can get more information about the current filter in the Properties dialog box.
 Effects of filtering on calculations
Totals can include only the displayed data, or both visible and hidden data. The default is to exclude hidden data from totals. You can change the setting to include or exclude hidden data in totals. This setting affects only data that's hidden by filtering row and column fields; data that's hidden by using filter fields is always excluded from totals.
 About filtering data in a PivotChart view
You can use the filter feature to find specific data values or all data that matches a value.
Filtering a field (Autofiltering) You can filter fields in the category, series, and filter areas. When you filter a field, you select one or more items of data in the field that you want to view, and hide the other items.
Filtering a field is particularly helpful when you have a large amount of source data but you want to focus on specific areas. When you filter a field, you can display the data for a single item, or you can select some items to display and other items to hide. You can filter on more than one field at a time to further narrow the focus.


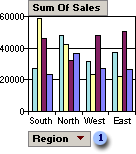
 Category field Region showing all items (not filtered)
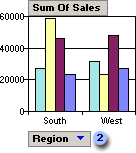
 Category field Region filtered to show South and West region items
Conditional filtering You can apply a filter to a series or category field to show the top or bottom n items based on a total. For example, you can filter for the three cities that generated the most sales or the five products that are least profitable. Instead of n items, you can also choose to filter for a certain percentage of items. For example, you can filter for the top 25% or bottom 25% of salespeople based on the number of orders handled. If there are 40 salespeople, after the filter is applied, you will see data for 10 people.
Filters are additive. Each filter you apply is added to the ones you already have in effect.
 Removing and reapplying a filter
You can display all data for all fields by turning off autofiltering. However, the filter settings are retained, so that when you turn autofiltering back on, the same data that was previously displayed or hidden is again displayed or hidden.
Filter settings are retained when you move fields to change the layout. Also, if you remove a field and later add the field back to the layout, the same items are again hidden.
If you don't want to retain your filter selections, make sure the AutoFilter button  is not selected before you start selecting items to filter. If the button is not selected, selecting new items to filter automatically turns filtering on and removes your former filter settings.
 Identifying the filters that are currently in effect
When items in a field are hidden by autofiltering, the drop-down arrow  in the field label is blue. Click the blue arrow
  to see the filter that is in effect.