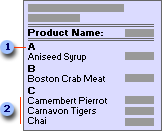
 Each group starts with the first letter of the product names in the group.
 Within each group, the product names are listed alphabetically.
The following table lists the sorting and grouping specifications for this report. Product Name in the first row of the Field/Expression column in the Sorting And Grouping box (the second column in the table) groups the records by the first letter of the product names. Product Name in the second row (the third column in the table) sorts the records alphabetically by product name under each letter.
| Field/ Expression | Product Name |
Product Name |
|---|---|---|
| Sort Order |
Ascending | Ascending |
| Group Header | Yes | No |
| Group Footer | Yes | No |
| GroupOn | Prefix Characters | Each Value |
| GroupInterval | 1 | 1 |
| KeepTogether | Whole Group | No |
Notes
- To print the first letter of each group in the group header, you use the Left function.
- You can look at the Alphabetical List of Products report in the Northwind sample database. To view this report, open the Northwind database in the Samples subfolder of your Microsoft Office folder, and then open the Alphabetical List of Products report in Design view.
 Example of a report that groups records on currency values (or AutoNumber or numeric values)

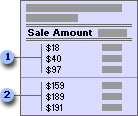
 Sales from $0 to $99
 Sales from $100 to $199
The following table lists the sorting and grouping specifications for this report. Sale Amount in the first row of the Field/Expression column in the Sorting And Grouping box (the second column in the table) groups the records in intervals of 100. Sale Amount in the second row (the third column) sorts the records in ascending amounts within each $100 interval.
| Field/ Expression | Sale Amount |
Sale Amount |
|---|---|---|
| Sort Order |
Ascending | Ascending |
| Group Header | No | No |
| Group Footer | Yes | No |
| GroupOn | Interval | Each Value |
| GroupInterval | 100 | 1 |
| KeepTogether | Whole Group | No |
Notes
-
Microsoft Access starts AutoNumber, Currency, and Number groups with 0 (zero). For example, if you set the GroupOn property to Interval, and set the GroupInterval property to 5, Microsoft Access groups the records like this: 0 to 4, 5 to 9, 10 to 14, and so on.
-
The Sales Totals by Amount report in the Northwind sample database groups records in intervals of 1,000. To view this report, open the Northwind database in the Samples subfolder of your Microsoft Office folder, and then open the Sales Totals by Amount report in Design view.
 Example of a report that groups records on date (or time) values

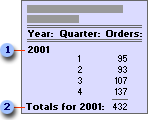
 Group header showing year
 Group footer showing totals for year
The following table lists the main sorting and grouping specifications for this report. Shipped Date in the first row of the Field/Expression column in the Sorting And Grouping box (the second column of the table) groups the records by year. Shipped Date in the second row (the third row of the table) groups the records for each year by quarter.
| Field/ Expression | Shipped Date |
Shipped Date |
|---|---|---|
| Sort Order |
Ascending | Ascending |
| Group Header | Yes | No |
| Group Footer | Yes | Yes |
| GroupOn | Year | Qtr |
| GroupInterval | 1 | 1 |
| KeepTogether | Whole Group | No |
Notes
- To print the year or quarter instead of a specific date, use the DatePart or Format function. To count the number of orders shipped, use the Count function.
- If you set the Group On property to Hour or Minute in the Sorting and Grouping dialog box, Microsoft Access groups records on unique hours or minutes starting from 1/1/1900. So, 10:00 a.m. on 1/1/1900 is different from 10:00 a.m. on 1/2/1900, and so on. To group records on hours or minutes, regardless of date, use the Hour or Minute function. For example, to see all flights that are scheduled to arrive at 10:00 a.m. on any day, group records on the following expression: =Hour([ArrivalTime])
- The Summary of Sales by Year report in the Northwind sample database prints quarterly sales for each year. The Summary of Sales by Quarter report in the Northwind sample database shows sales from multiple years for each quarter. To view one of these reports, open the Northwind database in the Samples subfolder of your Microsoft Office folder, and then open that report in Design view.