If you want to put all of the data in a workbook onto a Web page at one time, you can put an interactive or noninteractive version of an entire workbook on a Web page.
Interactive workooks
When you publish an interactive workbook on a Web page, the result is an HTML file that contains special components that allow browser users to interact with the workbook. For example, users can switch between sheets using a sheet selector, manipulate data and formatting, and change formulas in each sheet. The interactive components used in the HTML file cannot be opened and modified in Excel, so you should maintain a master copy of the Excel workbook from which you published so that you can make changes to it and republish the workbook if necessary.
Noninteractive workbooks
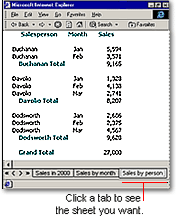
When you save a noninteractive workbook, the data appears as it would in Excel, including tabs that users can click to switch between worksheets. However, users cannot change or interact with the data in the browser. Saving an entire workbook as an HTML page is beneficial when you don't want to maintain a master copy of the Excel workbook, but rather want to be able to open the resulting HTML file directly in Excel and make and save changes using Excel features and functionality.
 Put a worksheet, range of cells, or other item on a sheet on a Web page
You can publish a spreadsheet or portions of a spreadsheet on a Web page either with or without interactive functionality.
When you publish without interactivity, users can view the data and formatting on the Web page, but not manipulate data or formatting.
If you want users to be able to manipulate data on your Web page, you can create a Web page from a Microsoft Excel worksheet or items from the worksheet by saving the data with spreadsheet functionality. When you publish interactively with spreadsheet functionality, users can do the following:
- Enter data
- Format data
- Calculate data
- Analyze data
- Sort and filter
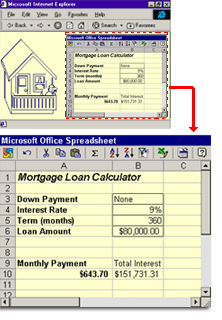
In interactive Web pages, users can change the data and layout of Web page items.
You can put the following on a Web page with spreadsheet functionality:
- Worksheets
- PivotTable reports
- External data ranges
- Ranges of cells
- Filtered lists
- Print areas
You might lose some formatting and features when you save with interactive functionality.
You can publish a chart with or without interactivity. When you publish without interactivity, an image of the chart in a picture format (.jpg) is saved and displayed on the Web page.
If you want to put an interactive chart or PivotChart report on a Web page, you can save the chart with interactive chart functionality.
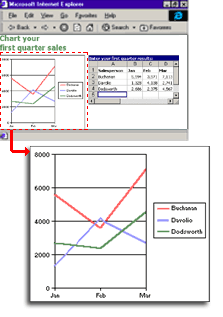
When you change the chart's corresponding data on the Web page, the chart is updated automatically.
To create a chart with interactive functionality, you must first have a chart or a PivotChart report in Excel. When you publish that chart interactively, Excel automatically includes the source data for the chart on the Web page. For a chart, Excel includes an interactive spreadsheet control. For a PivotChart report, Excel includes an interactive PivotTable list.
When users change the data in the spreadsheet or change the layout of the PivotTable list on the Web page, the corresponding chart is updated automatically. Users can also sort and filter the chart.
If you want to change the size of the chart on the Web page, you can open the Web page in either Microsoft FrontPage or data access page Design view in Microsoft Access and make the changes there.
 Put a PivotTable Report on a Web page
A PivotTable report is an interactive table in Excel that you can use to quickly summarize large amounts of data. Use PivotTable reports when you want to compare related totals or when you want Excel to do the sorting, subtotaling, and totaling for you.
You can publish a PivotTable Report with or without interactivity. When you publish without interactivity, users can view the report but cannot make changes to the table such as dragging fields or changing the types of summaries used, as can be done in Excel.
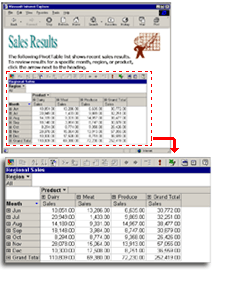
In a PivotTable list on a Web page, you can analyze data by changing the layout.
If you want your Web users to be able to interact with a PivotTable report or if you want to publish an external data range that you can refresh, you can put an interactive PivotTable list on a Web page. (The Web version of an interactive PivotTable report is called a PivotTable list.) When you publish interactively with PivotTable functionality, users can filter the data in the resulting PivotTable list, analyze the data by getting different views of it, and refresh external data in the browser.
Source data for PivotTable lists You can create an interactive PivotTable list from an existing PivotTable report or from other Excel data. If you use other Excel data and select PivotTable functionality in the Publish dialog box, Excel creates a PivotTable list on the Web page for you.
If you want users to be able to update an external data range on your Web page, you must specify PivotTable functionality to publish the external data range to a PivotTable list. The data is updated automatically from the source database when users open your Web page in the browser or when users click Refresh in the PivotTable list.
Limitations to consider You might lose some formatting and features when you save with interactive functionality.
 Put several items on a Web page
Most Web pages that you create will contain more than one item. For example, you might have a Web page that contains your logo, text, a PivotTable list, a list of noninteractive data, and a chart. The advantage of putting several items on a single page is that users need to look on only one Web page for all of the information they need.
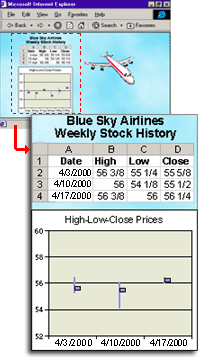
You can make parts of your Web page interactive and other parts noninteractive.
You can use features from several Microsoft Office programs to create one Web page. For example, you can save data as a Web page in Excel and then use Microsoft Access to add grouped data page controls or scripting. Then, you can open the Web page in Microsoft FrontPage and add themes to make your Web page look consistent with other pages in your site.
You can use any combination of interactive and noninteractive data, and data from any Office program. For example, you can use Access to get employee names, titles, and salaries from an employee database. Then, you can analyze the Access data in Excel. In Excel, you can add formulas that calculate the average salary per job title and create a chart. Save the analysis as an interactive spreadsheet or PivotTable list on a Web page. Then, use FrontPage to add a company logo and description of the data on the page.