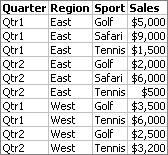
Source data for the illustrations in this topic.
The underlying rows or database records that provide the data for a PivotTable report. You can create a PivotTable report from a Microsoft Excel list, an external database, multiple Excel worksheets, or another PivotTable report.

Region, Sum of Sales, Quarter, and Sport are fields.
A category of data that's derived from a field in the source list or database. The Sport field, for example, might come from a column in the source list that's labeled Sport and contains the names of various sports (Golf, Tennis) for which the source list has sales figures.

Golf, Qtr1, Qtr2, and (All) are items.
A subcategory, or member, of a field. Items represent the unique entries from the field in the source data. For example, the item Golf represents all rows of data in the source list for which the Sport field contains the entry Golf.
The type of calculation used to combine values in a data field. PivotTable reports usually use Sum for data fields that contain numbers and Count for data fields that contain text. You can select additional summary functions such as Average, Min, Max, and Product.
To update a PivotTable report with the most recent data from the source list or database. For example, if a PivotTable report is based on data from a database, refreshing the report runs the query that retrieves data for the report. For reports based on worksheet data, when you change the worksheet data, you can click a button to refresh the report with the changes.
Field types

The blue field is a row field.
A PivotTable report that has more than one row field has one inner row field (Sport, in the example below), the one closest to the data area. Any other row fields are outer row fields (Region, in the example below). Items in the outermost row field are displayed only once, but items in the rest of the row fields are repeated as needed.
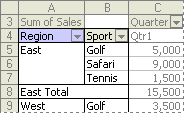
Region is an outer row field; Sport is an inner row field.

The blue field is a column field.

The blue field is a page field.
Page fields allow you to filter the entire PivotTable report to display data for a single item or all the items.

The blue field is a data field.
Data fields provide the data values to be summarized. Usually data fields contain numbers, which are combined with the Sum summary function, but data fields can also contain text, in which case the PivotTable report uses the Count summary function.
If a report has more than one data field, a single field button named Data appears in the report for access to all of the data fields.
Layout
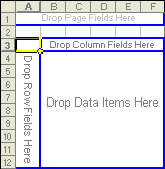
The blue outlined regions you see when you finish the steps of the PivotTable and PivotChart wizard. To lay out a PivotTable report, you drag fields from the field list window and drop them onto the drop areas.
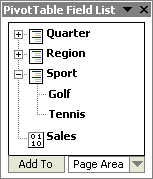
A window that lists all of the fields available from the source data for use in the PivotTable report. If a field is organized in levels of detail, you can click  or
or  to show or hide the lower levels. To display the data from a field in the PivotTable report, drag the field from the field list to one of the drop areas.

A list of the items available for display in a field. If the field is organized in levels of detail, you can click  or
or  to see which lower-level items are selected for display. A double check mark means that some or all of the lower-level items are displayed.

The blue cells are in the data area.
The part of a PivotTable report that contains summary data for the row and column fields. For example, cell B5 contains a summary of all of the sales amounts for Golf in Qtr1.

Classic format
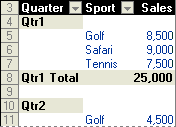
Indented format
In a PivotTable report in indented format, the data for each row field is indented. The summarized figures for each data field appear in a single column.
OLAP terms
OLAP stands for On-Line Analytical Processing, a way to organize very large business databases. OLAP data is set up to fit the way you analyze and manage data, so that it takes less time and effort to find the information you need.
A field that organizes a single type of data into a hierarchy with levels of detail. For example, an OLAP database could contain a Time dimension providing data for levels Year, Month, Week, and Day, allowing you to create reports that let you compare day-to-day sales results or view a summary of your sales for an entire year.

One rung on the ladder of detail for a dimension. For example, the Geography dimension illustrated above has four levels: Country, Region, City, and Site. In a PivotTable report that contains this dimension field, you can display a high-level summary by country, or drill down to view detailed data for specific regions and cities.
Additional information that's available about the items in an OLAP dimension field. For example, if a Geography dimension has property fields Population and Average Income available, you could create a PivotTable report that displays the sales figures for cities where your products are selling well. By displaying and analyzing the population and income figures for these cities, you could target cities with similar demographics for your marketing campaign.
 Field
Field