Returns the Pearson product moment correlation coefficient, r, a dimensionless index that ranges from -1.0 to 1.0 inclusive and reflects the extent of a linear relationship between two data sets.
Syntax
PEARSON(array1,array2)
Array1 is a set of independent values.
Array2 is a set of dependent values.
Remarks
- The arguments must be either numbers or names, array constants, or references that contain numbers.
- If an array or reference argument contains text, logical values, or empty cells, those values are ignored; however, cells with the value zero are included.
- If array1 and array2 are empty or have a different number of data points, PEARSON returns the #N/A error value.
- The formula for the Pearson product moment correlation coefficient, r, is:
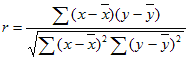
where x and y are the sample means AVERAGE(array1) and AVERAGE(array2).
Example
The example may be easier to understand if you copy it to a blank worksheet.
 How?
How?- Create a blank workbook or worksheet.
- Select the example in the Help topic. Do not select the row or column headers.

Selecting an example from Help
- Press CTRL+C.
- In the worksheet, select cell A1, and press CTRL+V.
- To switch between viewing the results and viewing the formulas that return the results, press CTRL+` (grave accent), or on the Tools menu, point to Formula Auditing, and then click Formula Auditing Mode.
|
|