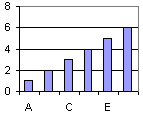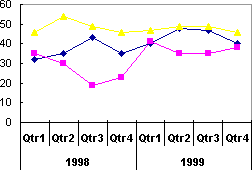
- Click the category axis with the labels and tick marks you want to change.
- On the Format menu, click Selected Axis, and then click the Scale tab.
- Do one or both of the following:
- Specify the frequency at which you want categories on the category (x) axis to be labeled
In the Number of categories between tick-mark labels box, type 1 to label every category, type 2 to label every other category, type 3 to label every third category, and so on.
- Specify the number of categories you want between each pair of tick marks on the category (x) axis
Type a number in the Number of categories between tick marks box.
Note When you have more than one line of category axis labels, you cannot change the number of categories between tick mark labels or the number of categories between tick marks.
- Specify the frequency at which you want categories on the category (x) axis to be labeled
 Change where the value (y) axis crosses the category (x) axis
- Click the category axis you want to change.
- On the Format menu, click Selected Axis, and then click the Scale tab.
- Do one of the following:
 Specify the category number where you want the value (y) axis to cross the category (x) axis
- Type the number in the Value (Y) axis crosses at category number box.
- Select the Value (Y) axis crosses between categories box to have the value (y) axis cross the category (x) axis at the edge of the category indicated in the Value (Y) axis crosses at category number box.
If this box is selected, data points are plotted between tick marks; if this box is cleared, points are plotted at the tick-mark positions.
- To have the edges of an area chart meet the edges of the plot area, clear the Value (Y) axis crosses between categories box.
 Specify that the value (y) axis cross the category (x) axis after the last category on the x-axis
Select the Value (Y) axis crosses at maximum category box. This option overrides the Value (Y) axis crosses at category number value.
Note When you have more than one line of category axis labels or when you are working with a 3-D chart, you cannot change where the value (y) axis crosses between categories.
 Change the alignment and spacing of multiple-level category labels

When you have multiple-level category labels in your chart, you can change the alignment of all but the first level of labels. You can also change the amount of space between each level of labels.
- Click the category axis you want to change.
- On the Format menu, click Selected Axis, and then click the Alignment tab.
- To change the label alignment, click the position you want in the Alignment box.
To change the spacing between the levels, select a value in the Offset box. The higher the value, the more space between each level.
 Change chart category axis labels
- Click the cell that contains the label name you want to change.
- Type the new name, and then press ENTER.
- Click the chart, and then click Source Data on the Chart menu.
- In the Category axis labels box on the Series tab, specify the worksheet range you want to use as category axis labels. You can also type the labels you want to use, separated by commas, for example:
Division A, Division B, Division C
If you type the label text in the Category axis labels box, the category axis text is no longer linked to a worksheet cell.