Calculates, or predicts, a future value by using existing values. The predicted value is a y-value for a given x-value. The known values are existing x-values and y-values, and the new value is predicted by using linear regression. You can use this function to predict future sales, inventory requirements, or consumer trends.
Syntax
FORECAST(x,known_y's,known_x's)
X is the data point for which you want to predict a value.
Known_y's is the dependent array or range of data.
Known_x's is the independent array or range of data.
Remarks
- If x is nonnumeric, FORECAST returns the #VALUE! error value.
- If known_y's and known_x's are empty or contain a different number of data points, FORECAST returns the #N/A error value.
- If the variance of known_x's equals zero, then FORECAST returns the #DIV/0! error value.
- The equation for FORECAST is a+bx, where:

and:
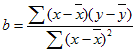
and where x and y are the sample means AVERAGE(known_x's) and AVERAGE(known y's).
Example
The example may be easier to understand if you copy it to a blank worksheet.
 How?
How?- Create a blank workbook or worksheet.
- Select the example in the Help topic. Do not select the row or column headers.

Selecting an example from Help
- Press CTRL+C.
- In the worksheet, select cell A1, and press CTRL+V.
- To switch between viewing the results and viewing the formulas that return the results, press CTRL+` (grave accent), or on the Tools menu, point to Formula Auditing, and then click Formula Auditing Mode.
|
|