instead of automatic subtotals.
 How subtotals are calculated
Subtotals Excel calculates subtotal values with a summary function, such as Sum or Average. You can display subtotals in a list with more than one type of calculation at a time.
Grand totals Grand total values are derived from detail data, not from the values in the subtotal rows. For example, if you use the Average summary function, the grand total row displays an average of all detail rows in the list, not an average of the values in the subtotal rows.
Automatic recalculation Excel recalculates subtotal and grand total values automatically as you edit the detail data.
You can insert subtotals for smaller groups within existing subtotal groups. In the example below, subtotals for each sport are in a list that already has subtotals for each region.
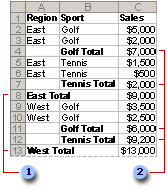
 Outer subtotals
 Nested subtotals
Before inserting nested subtotals, be sure to sort the list by all the columns for which you want subtotal values, so that the rows you want subtotaled are grouped together.
Create summary reports When you add subtotals to a list, the list is outlined so that you can see its structure. You can create a summary report by clicking the outline symbols  ,
,  , and
, and  to hide the details and show only the totals.
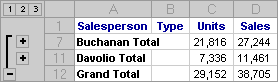
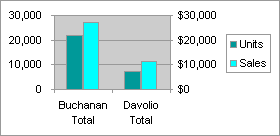
Chart the summary data You can create a chart that uses only the visible data in a list that contains subtotals. If you show or hide details in the outlined list, the chart is also updated to show or hide the data.