

The bottom pane of the trace view contain hotspot Summary tables. The table are summarizing the API call, and display each of the API types significant times. These tables can be used for quick identification of performance bottlenecks in the analyzed frame.
The table below specified each of the API table columns.
CPU \ GPU properties:
|
Name |
Description |
|
Call |
The API call name |
|
The maximum duration for this call type. Clicking on the link in this column will select the specific call in the API table, and the timeline. |
|
|
The minimum duration for this call type. Clicking on the link in this column will select the specific call in the API table, and the timeline. |
|
|
Average Time |
The average duration for this API type. |
|
The cumulative duration for all calls with this API type. |
|
|
% of total Time |
The percentage of all this API type calls, from the frame duration. |
|
# of Calls |
The calls count for this API type |
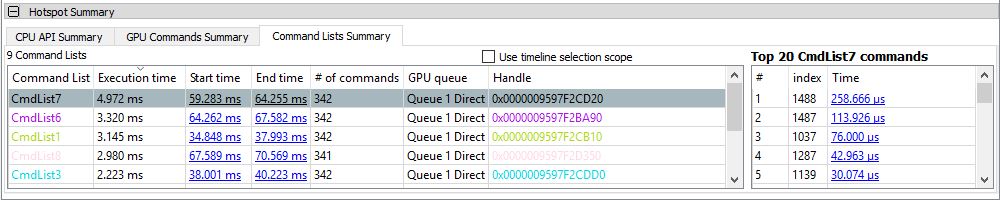
CodeXL 2.1 supports both DX12 and Vulkan API. The hotspot summary table shows DX12 Command list \ Vulkan command buffer properties:
|
Name |
Description |
|
Command List\Buffer |
The command list \ buffer name |
|
Execution Time |
The duration for this command. |
|
Start Time |
The start time of this command list \ buffer. Clicking on the link in this column will select the specific item in the timeline. |
|
End Time |
The end time of this command list \ buffer. Clicking on the link in this column will select the specific item in the timeline. |
|
# of commands |
The number of commands in this command list \ buffer. |
|
GPU Queue |
The GPU queue associated with this command list \ buffer. |
|
Handle |
The address of this command list \ buffer. |
· Use timeline selection scope: when checked, the summary tables will reflect the selected timeline frame (which is painted within the red boundaries above). When un-checked, the summary tables will display the whole frame time range.
Selection of a line in the API summary table, will fill the top 20 calls, sorted by the time.