1. To navigate to Call Graph view, do one of the following:
·
In the CodeXL Explorer pane,
double-click on Call Graph node in the profile session tree entry
created for this profile run.
The Call Graph view is displayed with Callstack samples collected for
the profiled application.
· In the Overview page, right-click on the 5 Hottest Functions table entry, and select Display in Call Graph View. The Functions view is displayed with Callstack samples collected for the profiled application.
·
In Functions view, select a
function from the Functions table, and select Display in Call Graph
View
This displays the Call Graph constructed from the callstack samples collected
from the profiled application.
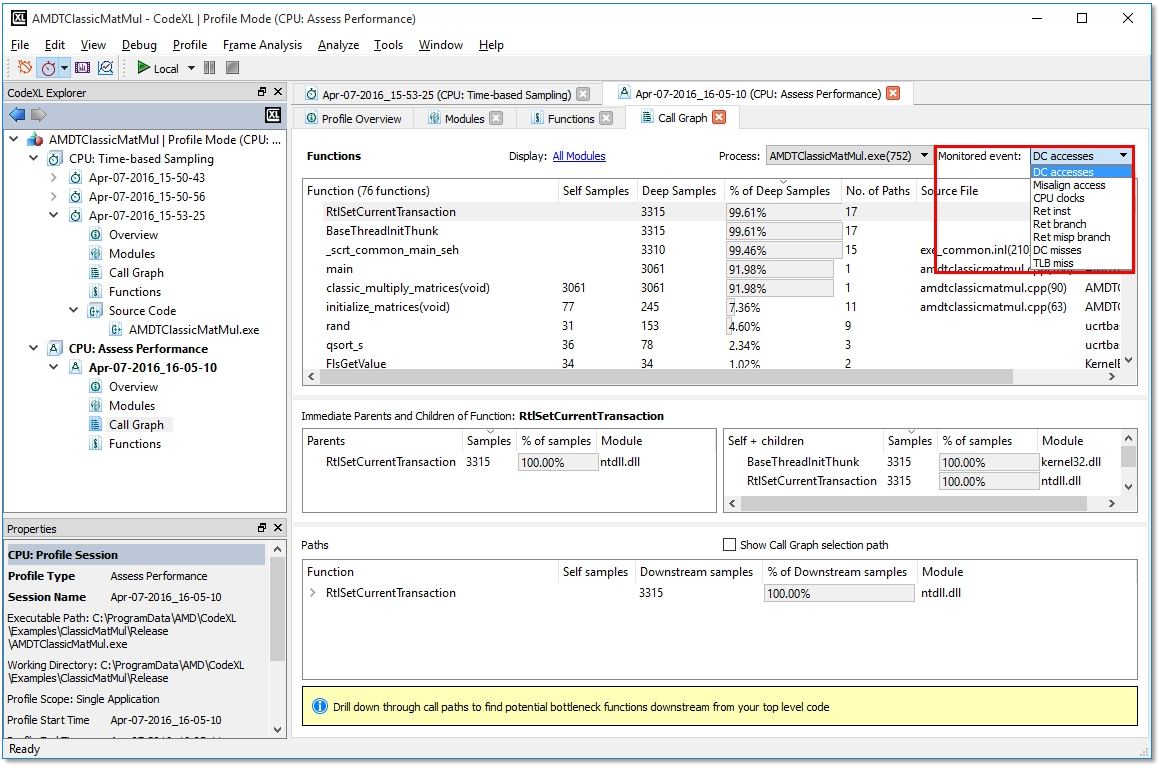
2.
Click on the Display: All Modules
link to enable Display system modules.
This displays the callstack samples collected from the system modules.
3. Click the OK button to save the Display filter settings.
4. Click on the Process combo box to select the process for which you want to view the Call Graph.