 CodeXL User Guide
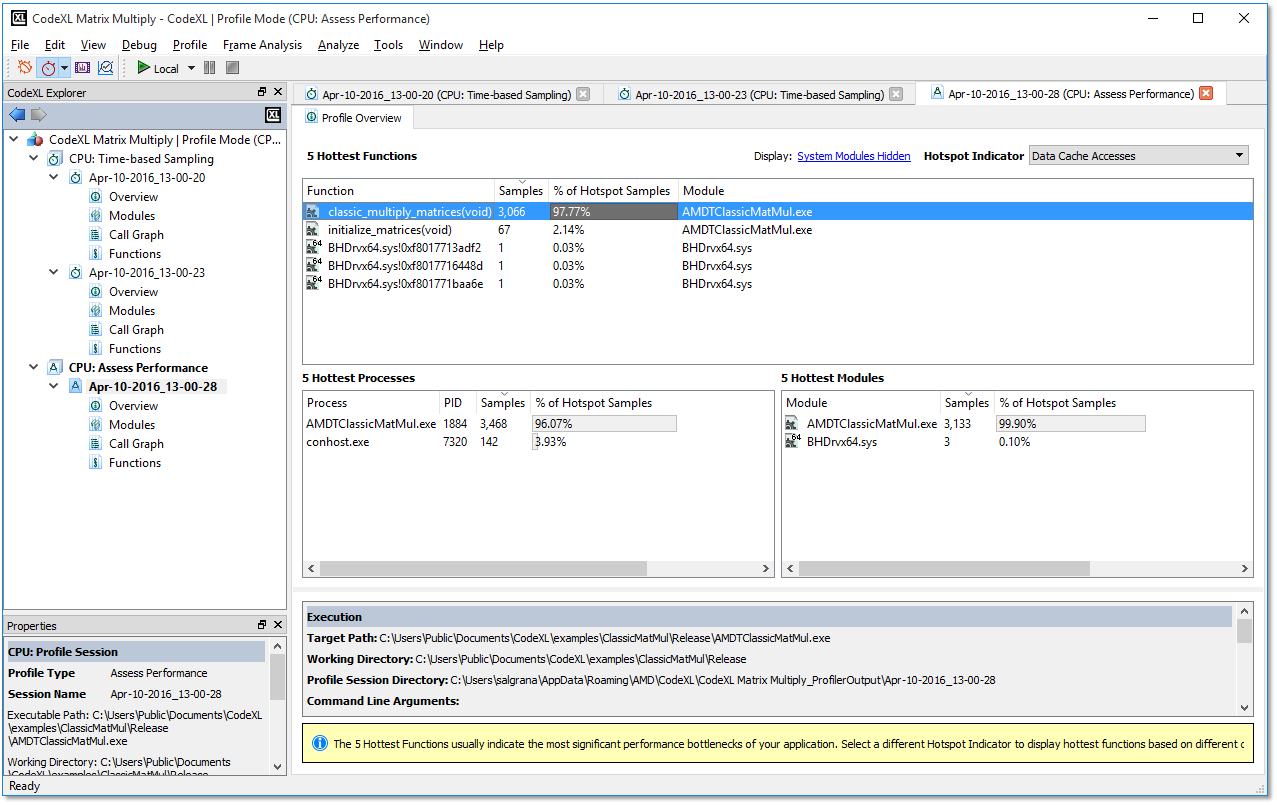
The CPU Profile Session Overview Page describes an overview of the data collected during the profile session.
The top section of the overview page contains the following data tables: Hot Spot Functions table, Hot Spot Modules table and Hot Spot Processes table. Note that the Processes table is only displayed when running a system-wide profile session.
The overview data tables can get a zoom-out image of the performance of the executed application. Use these tables to review the summary of hot spot locations in your application. The tables display the data organized by a 'hot spot indicator'.
The bottom section of the overview page contains general information for this session.

Hot Spot Indicator
The screenshot above displays an Assess Performance session overview. The combo box at the right side of the view is a hot-spot indicator combo box. Selecting another field in this combo box causes the data in the view to be re-calculated. The samples column contains the hot spot functions/modules/processes calculated with the new indicator. The screenshot below displays the same session overview, after selecting "CPU clocks not halted (cycles)" in the hot spot indicator combo box. The tables are updated to display hottest functions / modules/ processes according to each of the monitored event / data field listed in the combo box. The table is updated with the CPU clocks sample count and percent, and the "Samples" column tooltip now specifies the CPU Clocks event.

Session Properties Section
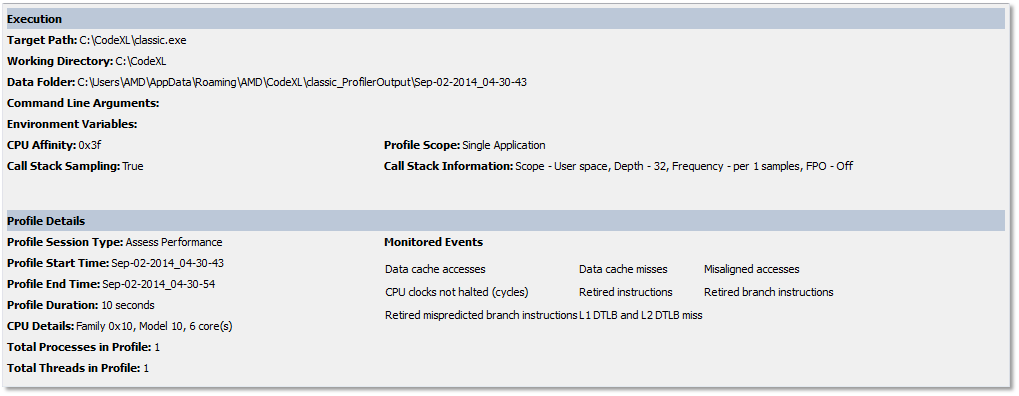
The bottom section of the overview page contains the profiled session properties.

|
Execution |
Contains the session execution properties: · Target Path, Working Folder, Data Folder, Command Line Arguments and Environment Variables. These session settings are general CodeXL project settings. Use the CodeXL Project Settings Dialog to configure them. · CPU Affinity, Call Stack Sampling, System-Wide Profile, Call Stack Information -these settings are CPU profile project settings. Use the CodeXL CPU Profile Project Settings Dialog to configure them. |
|
Profile Details |
Contains the following information of the profile session: Profile session type (See CPU Profile Types for details), Profile start-end time, Duration, CPU Family and Total Amount of Processes and Threads. This section also contains a list of monitored events collected for this session. |
Navigating to other views
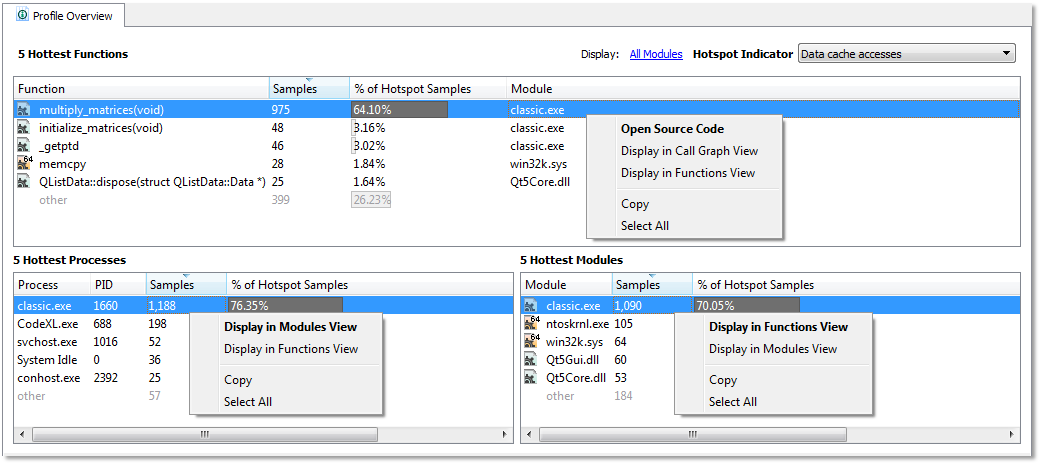
The Overview page describes a zoomed-out image of the profiled session. For more information about bottle necks in your application, use Modules View, Functions View , and Call Graph View. You can also open a Source-Code View to see a source-line level performance data. These views can be opened using the CodeXL Explorer Tree . Each of the tables in the overview page implements a right-click menu that lets you navigate between session views.

Per-Process vs System-Wide Profile Session
A CPU Profile session can be:
· Per-process ‒ Only the target application is profiled. This is the default.
· System-Wide ‒ Samples are taken for all running processes in the system. Use the CodeXL CPU Profile Project Settings Dialog to check / un-check the system-wide profile option.

