 CodeXL User Guide
This displays a module-by-module detailing of performance data. Use this view to see the distribution of hot spots among the modules of your application. The data displayed in this view is collected for the session profile type. The screenshot below displays an Assess Performance profile session, with a single process (classic.exe). Modules with a high sample count usually indicate performance bottlenecks. Sort the modules table according to a specific counter to highlight potential bottlenecks.

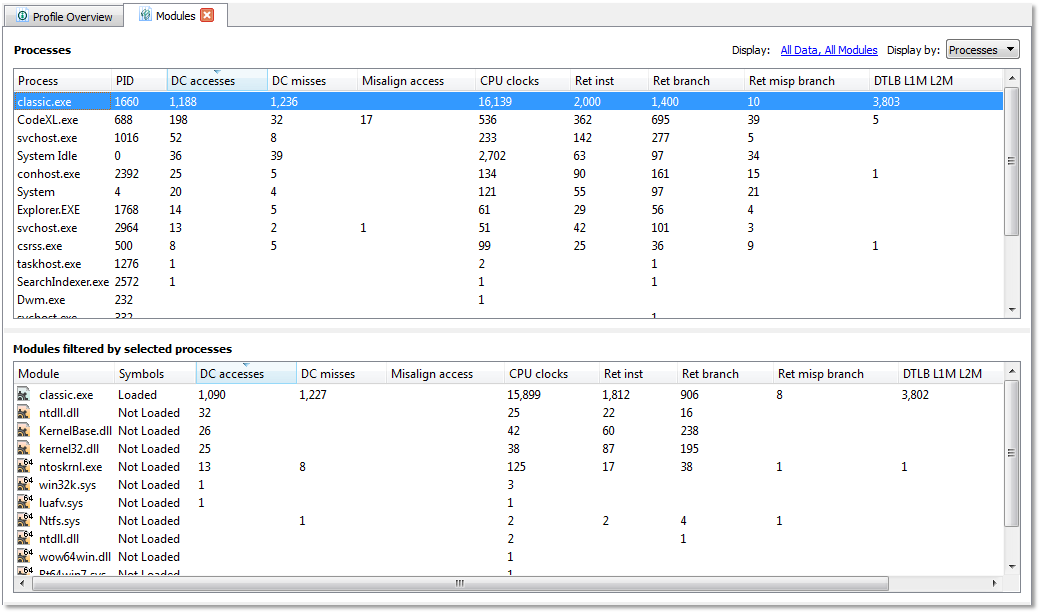
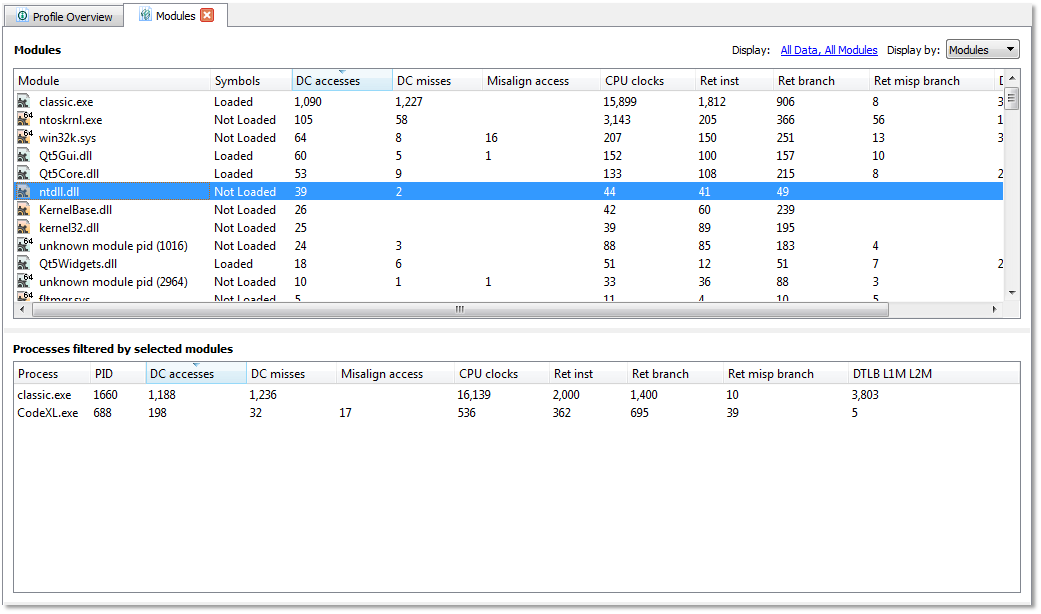
The modules view displays two tables: processes and modules. The following screenshot shows the “classic” project in a system-wide session. The combo-box on the right side of the view lets you select display processes or modules in the top table.
Display Modules View by Processes
The top table displays processes. Select one or more processes in the top table, and the bottom table displays only the modules used by the selected processes.

Display by Modules
The top table displays modules. Select one or more modules in the top table, and the bottom table displays only the processes used by the selected modules.

Modules View Context Menus
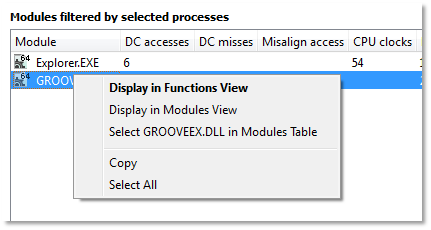
The following two screenshots display the context menus for the modules and processes tables. The context menus lets you:
· Display in Functions View ‒ Displays the selected module / process in the functions view.
· Select "ModuleName.dll" in modules table ‒ Switches to "Display by Modules" and selects ModuleName.dll in the modules table.


Modules View Display Settings
Use the display filter link to open the Display Settings Dialog and change the properties of the currently displayed session.


