

The Power Profiler Summary View displays an analysis of the values measured throughout the session. Similarly to the Timeline View, this view is updated in real-time when power profiling sessions are running. At the upper-left side of the summary view, you can see the session duration which is the amount of time that the profiling session was in progress. The uppermost chart (titled “Power”) shows the Total APU Power/Energy consumption. This chart has two modes: Cumulative and Average. The Cumulative mode displays the cumulative energy consumed by the APU components, measured in Joules. The Average mode displays the average power consumption of the APU components, measured in Watts. For each of these two modes, the Total APU Power Consumption value at the top of the summary view represents the value consumed by the whole APU.
If CPU or GPU frequency counters were activated for the session, you will find additional histogram graphs below the Power graph in the Summary View:
CPU Frequency Graph
This stacked histogram displays for each CPU core how much time it spent at each frequencies range.
GPU Frequency Graph
This histogram displays how much time the GPU spent at each frequencies range.
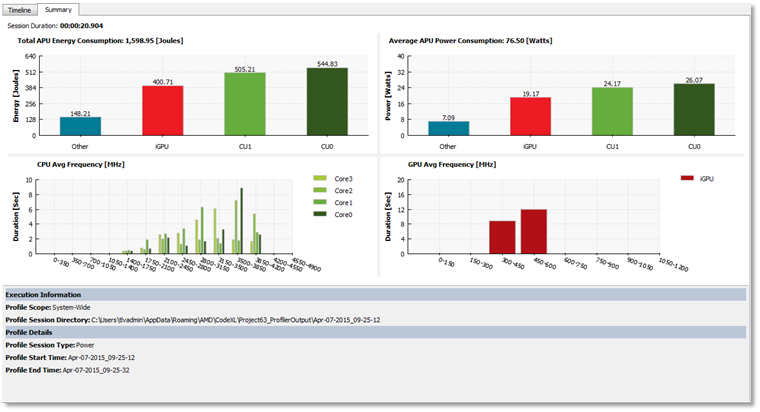
At the bottom of the Summary View you can find useful information about the current session:
- Target Path: The target application’s path. In system-wide sessions, this field will be left empty.
- Working directory: the target application’s working directory. In system-wide sessions, this field will be left empty.
- Profile Session Directory: the directory where CodeXL stored the session file.
- Command Line Arguments: the target application’s command line arguments (if any). In system-wide sessions, this field will be left empty.
- Environment Variables: the target application’s environment variables (if any). In system-wide sessions, this field will be left empty.
- Profile Scope: the scope of the current session (either system-wide, or system-wide with focus on an application).
- Profile Session Type: the type of this profiling session. This field will always be filled with the “Power” value for power profiling sessions.
- Profile Start Time: the time when the current session began.
- Profile End Time: the time when the current session ended.