

The Source Code / Disassembly view shows the source lines annotated with assembly instructions and sample count for a selected function.
Opening the Source Code View
This view can be opened from one of the following ways:
· Overview Page: Double-click on a function in the functions table, or right-click on a function, and select Open Source Code.
· Functions View: Double-click on a function in the functions table, or right-click on a function, and select Open Source Code.
· Call-Graph View: Right-click on a function in the functions, and select Open Source Code.


Open Source Code View from Overview Page Open Source Code View from Call Graph View
After selecting a function and clicking Open Source Code, a source code view will be created.
A separate instance of source code view is opened for each module. When the source code is created, a node is added in the CodeXL Explorer, called Source Code. Under this node, a node will be created for the module’s source code view.

If CodeXL cannot locate the source file, a file selection dialog is opened, and the user will be asked to locate the source file. If the source file will not be located, the source code view will display only disassembly.
On the top of the source code view, a combo-box is created with the list of the module’s functions. The function that was right-clicked will be selected in the functions combo-box, and will be highlighted in the code.

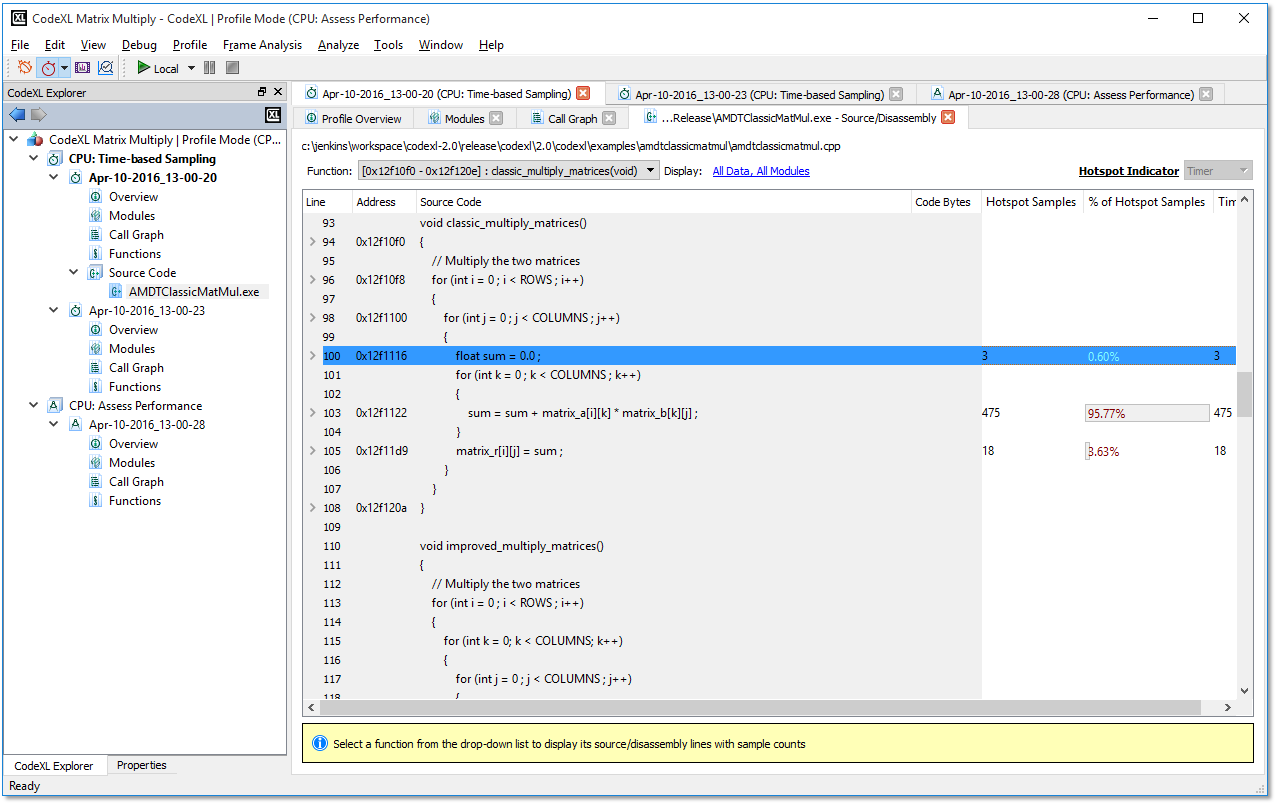
Source Code View opened for "multiply_matrices" function
Data Displayed in Source Code View
The source code consists of a table displaying the following data for each source code line / disassembly line in the current displayed source file:
|
Line |
The source code line number. |
|
Address |
Memory address where each instruction is located. |
|
Source Code |
The source code for the current line. |
|
Code Bytes |
Byte representations of the actual machine instructions. |
|
Hotspot Samples |
The amount of samples collected for the current hotspot indicator event / metric. The hotspot indicator is selected in the hotspot indicator combo-box. |
|
% of Hotspot Samples |
The precentage of samples collected for the current hotspot indicator event / metric. The percentage is calculated relatively to the currently display function (all the function source code lines will sum up to 100%). The hotspot indicator is selected in the hotspot indicator combo-box. |
|
Samples count for each of the collected / calculated data of the current session |
The following columns will contain the amount of samples collected for the monitored events and calculated metrics. Use the Display Settings Dialog to select which of the metrics will be displayed currently in the table. |
Functions combo-box

The functions combo-box contain the list of the current module’s functions. Selecting a function will highlight the function in the displayed source code, or will display disassembly code for the requested function.

Process IDs combo-box

Thread IDs combo-box
Process ID / Thread ID combo-boxes
The process IDs / Thread IDs combo-boxes are displayed only in cases where the displayed module is multi-process or multi-threaded. Use the process IDs and thread IDs combo-boxes to display the selected process / thread ID collected samples.
Navigating through the presented data
The navigation can be done using the mouse wheel, the Page Down\Up keyboard keys or the Down\Up Arrow keyboard keys. While you navigate through a large disassembly, CodeXL will fetch another block of disassembly data as you scroll down and reach the bottom. The size of the data block that is being automatically fetched can be configured in the CPU Profiling global settings. To open the CPU Profiling global settings, go to the CodeXL menu bar and click on Tools->Options. Then, choose the CPU Profile tab, and edit the value in the text box to set the data block size in bytes:
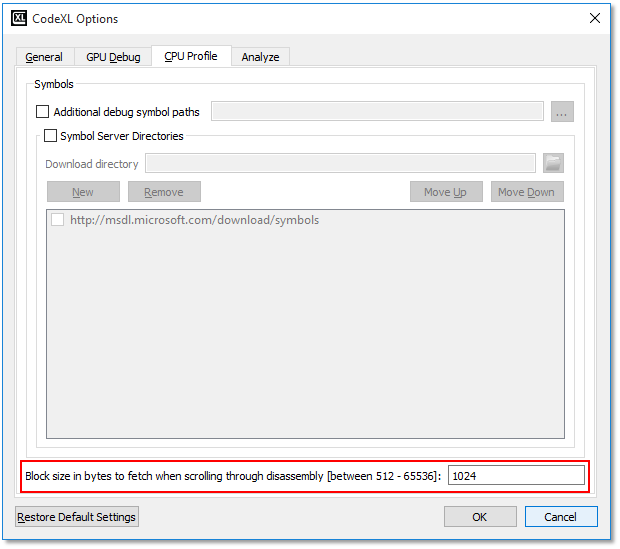
Changing the size of the data block which is being automatically fetched when scrolling through disassmbly
Source Code View Display Settings
In order to configure the source code view display settings, click the display settings link on the top of the source code view.

The display settings dialog can be used to select which columns will be displayed in the source code view table, to display the data separately for each core / NUMA node etc’. See more details on the display settings in Profile Session Display Settings.

The function "initialize_matrices" is highlighted after being selected in the functions combo-box
Hotspot Indicator combo-box
The hotspot indicator combo-box contains the list of monitored events / metrics that is currently displayed in the source code view. Each of these events / metrics can be selected. The selection of an event / metric will update the ‘Hotspot Samples’ and ‘% of Hotspot Samples’ columns to contain the data collected for this event / metric. Use the hotspot indicator combo-box to look for the most significant performance bottlenecks of your application.

Hotspot Indicator combo-box for Assess Performance Profile Session
Context Menu
The source code context menu can be opened by right-clicking on one of the items in the table.
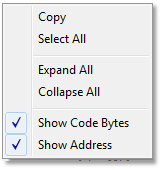
The context menu contain the following commands:
|
Copy |
Copy the selected row/s in the source code view table. |
|
Select All |
Select all the rows in the source code view table. |
|
Expand All |
Expand all the items in the source code table (show all the disassembly lines) |
|
Collapse All |
Collapse all the items in the source code table (hide all the disassembly lines) |
|
Show Code Bytes |
Show / hide the code bytes column in the source code view table |
|
Show Address |
Show / hide the address column in the source code view table |