The GPU Profiler component in CodeXL is a performance analysis tool that gathers data from the API run-time and GPU for OpenCL™ , HSA or DirectCompute applications.
This information can be used by developers to discover bottlenecks in the application and find ways to optimize the application's performance. The GPU Profiler can also be used as a command-line tool.
Features of the GPU Profiler include:
· Measure the execution time of an OpenCL™, HSA or DirectCompute kernel.
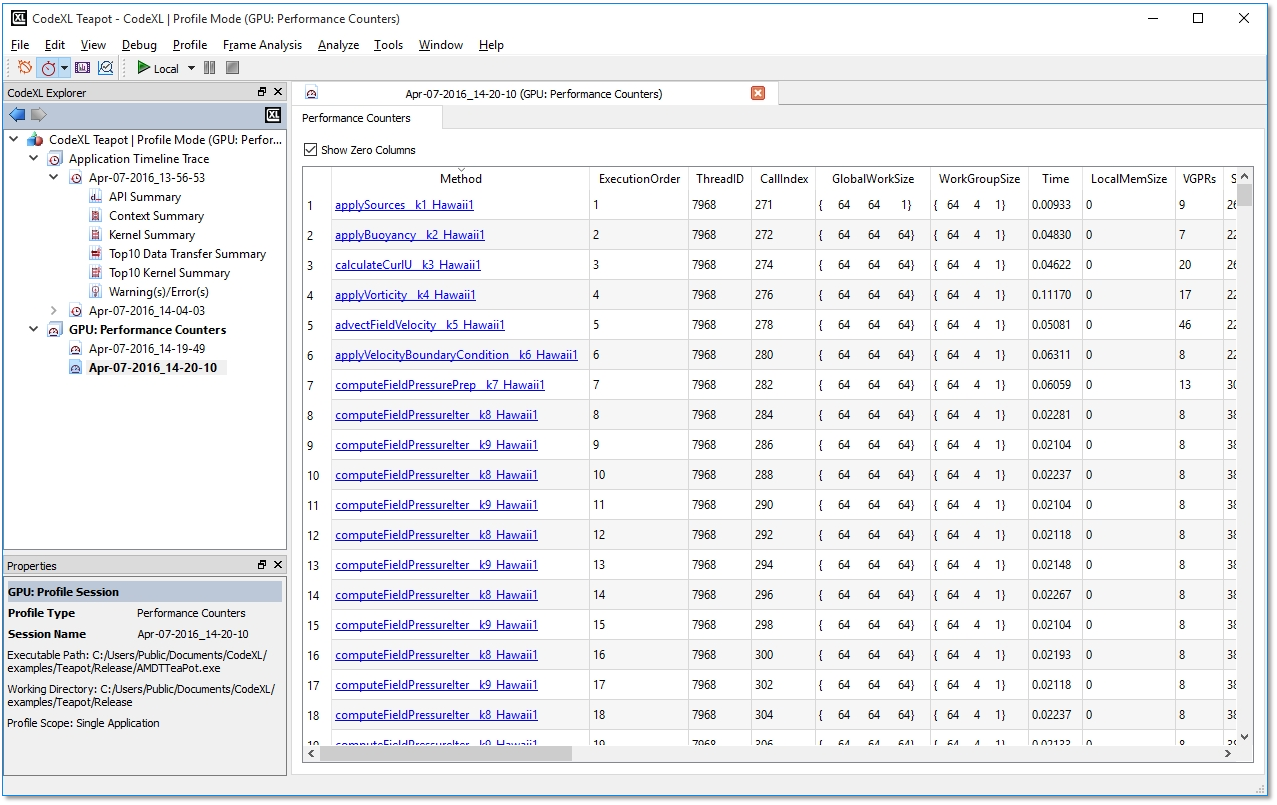
· Query the hardware performance counters on an AMD Radeon™ graphics card.
· Use the AMDTActivityLogger API to trace and measure the execution of segments in the program.
· Compare multiple runs (sessions) of the same or different programs.
· Store the profile data for each run in a text file.
· Display the IL/HSAIL and ISA (hardware disassembly) code of the kernel for OpenCL™ kernels and DXASM code for DirectCompute kernels.
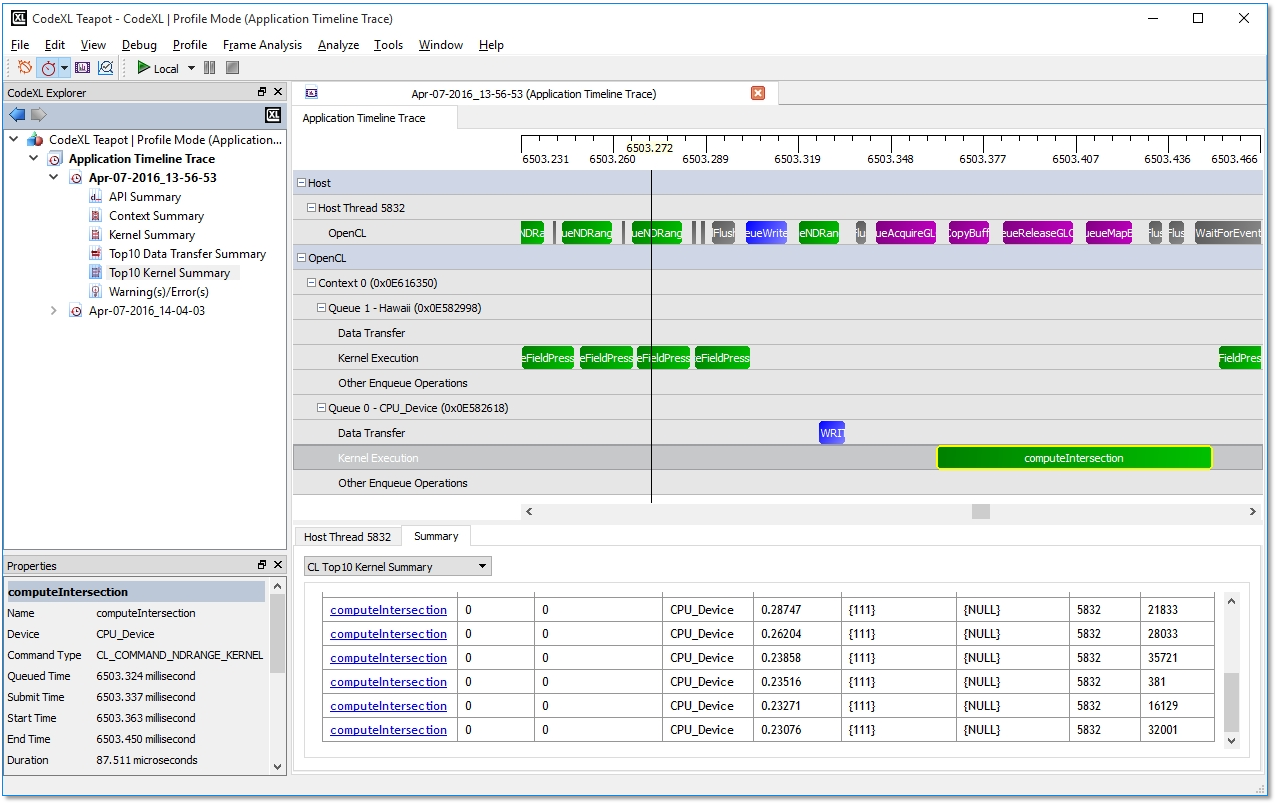
· Show a timeline (including data transfer and kernel dispatch) and an API trace for OpenCL™ or HSA programs.
· Calculate and display kernel occupancy info, which estimates the number of in-flight wavefronts on a compute unit as a percentage of the theoretical maximum number of wavefronts that the compute unit can support.
The following screenshots display the results of the Application Timeline Trace and Performance Counters sessions for an OpenCL™ program.