 CodeXL User Guide
To run a CPU Profile session:
1.
Open or create a CodeXL project

2.
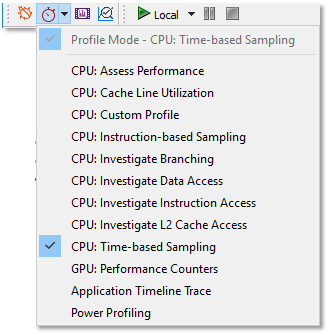
Select a CPU profile type. See detailed
information for each of CodeXL supported CPU Profile Types
In the Active Mode toolbar, click the Profile Mode toolbar button to change the
mode to Profiling (Profile > Profile Mode). Select any CodeXL CPU type of
profile (Profile > CPU: Assess Performance for example).
3. Use the CPU Profile Setting dialog to configure the profile session parameters.
4.
Click the Start CodeXL Profiling
toolbar button,  , to start profiling.
5.
Optional: Pause / Stop the data
collection of the profiled application using the execution toolbar buttons:  .
.
Stopping/pausing the profile session is optional. You can let the application
run to its end and then the profiling session will automatically end. For long
running applications, pausing allows you to control when the profiling data
collection occurs so it matches the stage in your application execution that
you want to profile.
6. When the profiled application execution is over, CodeXL processes the data collected, and a profile session window is opened. See the View and Analyze the Profile Session Data Analysis section.

