 CodeXL User Guide
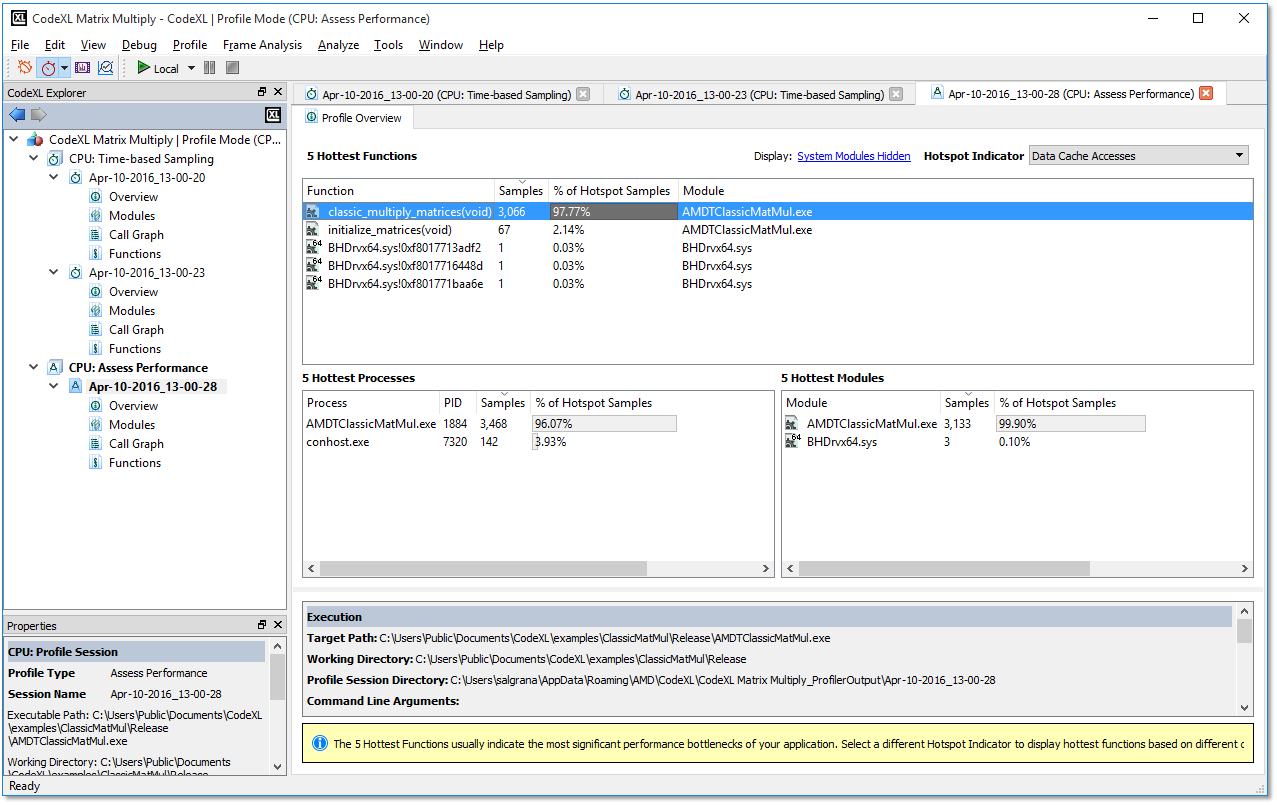
The CPU Profiling project consists of the CodeXL Explorer pane, the data pane, menu and toolbar commands, and subsequent tabs and views that are displayed during the profile sessions.
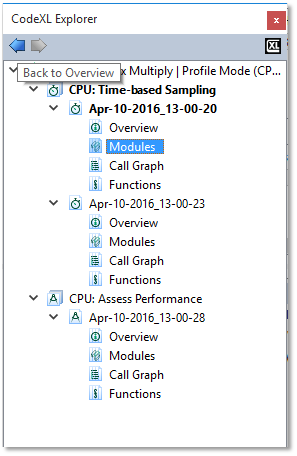
The CodeXL Explorer pane lists the profile sessions collected for the current project, organized by profile session type.
The CodeXL Explorer lets you:
· Double-click on a session node in the tree, to open it in the data pane.
· Right-click on a tree node to delete, rename, or import sessions.
· Right-click on a session tree node to browse the folder that contains the session. In the screenshot below you can see the CodeXL explorer for “classic” project. The session in bold is the currently selected profile session, and the profile type in bold font (CPU: Assess Performance) is the profile type for the currently selected session.

Session Views Right-Click Menus
Another way to navigate between the profile session views is to use the session views' right-click menus. For example, in the screenshot below, the function "multply_matrices" is marked as a hot-spot in the overview page. Right-click on the function to see the following context menu commands:
Opening Source Code opens the source code for "multply_matrices" to show how the data samples are distributed within the selected function lines.
Display in Call Graph View opens the call graph view to show the "multply_matrices"' call paths.
Display in Functions View opens the functions view to see how the data is distributed within the functions in this module (classic.exe).

After clicking the "Display in Call Graph" command, the call graph view is opened, with the function "multiply_matrices" selected. When right-clicking on the function, a context menu is opened with the option to either display the function in source code or in functions view.

CodeXL Explorer Navigation Arrows
The CodeXL Explorer arrows record the navigation to each of the session views that were opened. Use these arrows to go back and forward between the displayed session views.


