 CodeXL User Guide
To start debugging or profiling an application:
1.
Create a CodeXL project.
A CodeXL project consists of general information for the debugged / profiled
application, such as command-line arguments, environment variables. The project
also configures debugging and profiling specific configurations.
2.
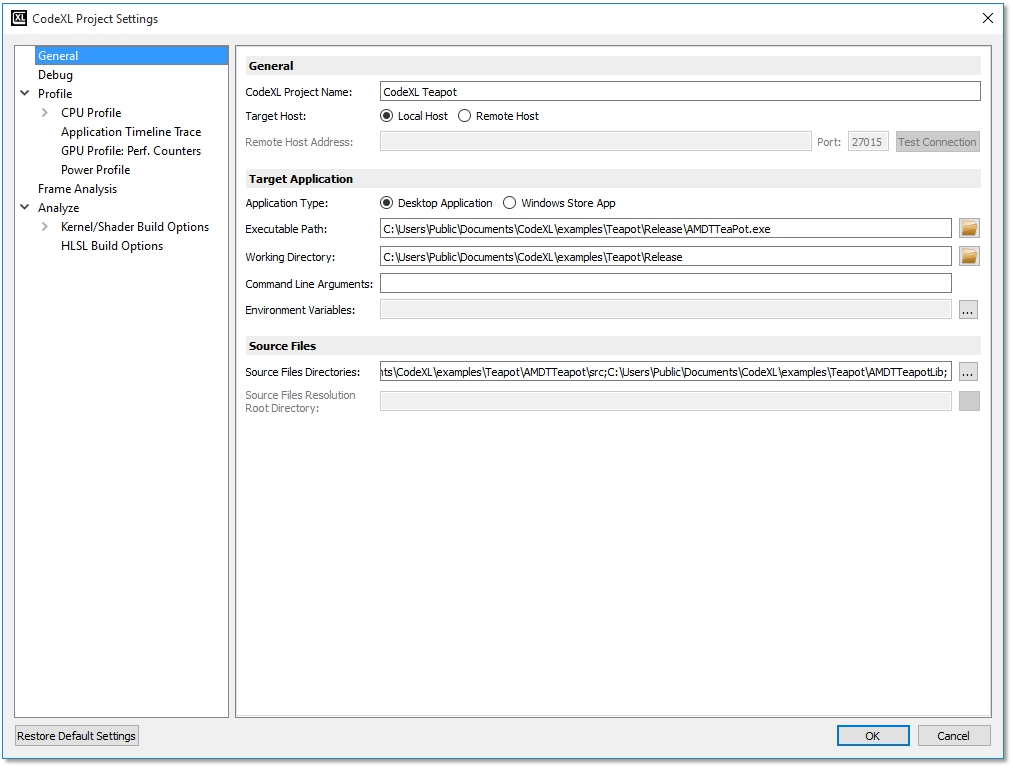
Use the File > New Project menu to open the new project dialog.
The same dialog can be used later to configure the project settings during the
debugging / profiling. (Debug > Debug Settings and Profile > Profile Settings menus)

General Project Settings
|
CodeXL Project Name |
The name of the current project used to identify a project in the Explorer views. |
|
Target Host |
The host on which the executable file will be debugged or profiled (Local / Remote). |
|
Remote Host Address |
The remote host address when the “Remote Host” option is selected. |
|
Port |
The port number on the remote host when the “Remote Host” option is selected. |
|
Test Connection |
Click to test the current connection settings. |
|
Application Type |
The type of application that will be debugged or profiled. The application can be either a desktop application or a Windows Store application. |
|
Executable Path |
The path to the executable / Windows Store application to be debugged or profiled. Use the Browse button for quick selection. |
|
Working Directory |
The directory in which the executable is to be debugged or profiled. Use the Browse button for quick selection. |
|
Command Line Arguments |
Arguments to be passed to the executable. |
|
Environment Variables |
A list of environment variables and their values to be set in the environment for the executable. |
|
Source Files Directory |
List of directories with the source code for the CPU profiled applications or the OpenCL™ kernels. Use the Browse button for quick selection. |
Specific Project Settings

