

There are two ways to open the Kernel Occupancy panel:
- Click on the kernel occupancy percentage in
the Kernel Occupancy column of the GPU Profiler Performance Counters Session panel
(OpenCL™ and HSA).
or - Click on the kernel occupancy percentage in the Kernel Occupancy column of the API Trace in the GPU Profiler Profiler Application Trace Session panel (OpenCL™ only).
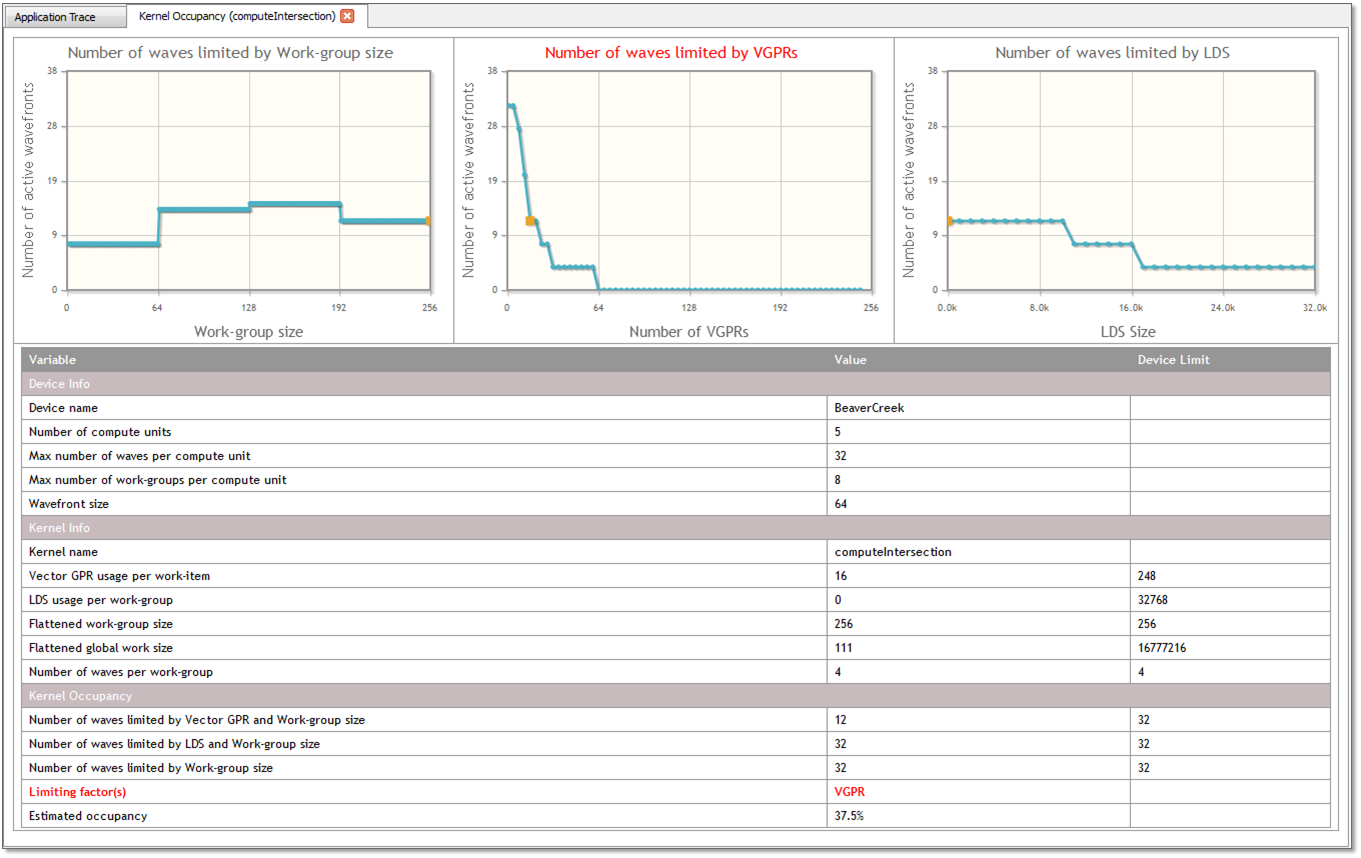
For kernels, this panel displays an HTML webpage which provides information about the occupancy of a particular kernel dispatch.
The top part of the page shows four graphs that provide a visual indication of how kernel resources affect the theoretical number of in-flight wavefronts on a compute unit. The graph representing the limiting resource has its title displayed in red text. More than one graph can have a red title if there is more than one limiting resource. In each graph, the actual usage of the particular resource being graphed is highlighted with an orange square. If you hover the mouse over a point in the graph, a popup hint is displayed showing you the current X and Y values at that location.
The first graph, titled Number of waves limited by Work-group size, shows how the number of active wavefronts is affected by the size of the work-group for the dispatched kernel. In the screenshot above, you can see that the highest number of wavefronts is achieved when the work-group size is in the between 64 and 256.
The second graph, titled Number of waves limited by VGPRs, shows how the number of active wavefronts is affected by the number of vector GPRs used by the dispatched kernel. In the screenshot above, you can see that as the number of VGPRs used increases, and the number active wavefronts decreases, in steps. Note this graph shows that more than 62 VGPRs can be allocated, even though 62 is the maximum number of VGPRs that can be allocated, since the shader compiler assumes the work-group size is 256 items by default (the largest possible work-group size). For the shader compiler to allocate more than 62 VGPRs, the kernel source code must be marked with the required_work_group_size kernel attribute. This attribute specifies to the shader compiler that the kernel is launched with a work-group size smaller than the maximum, allowing it to allocate more VGPRs. Thus, for X-axis values greater than 62, the VGPR graph shows the theoretical number of wavefronts that can be launched if the kernel specified a smaller work-group size using the attribute.
The third graph, titled Number of waves limited by SGPRs, shows how the number of active wavefronts is affected by the number of scalar GPRs used by the dispatched kernel. In the above screenshot, you can see that as the number of SGPRs used increases, the number active wavefronts decreases in steps.
The fourth graph, titled Number of waves limited by LDS, shows how the number of active wavefronts is affected by the amount of LDS used by the dispatched kernel. In the above screenshot, you can see that as the amount of LDS used increases, the number active wavefronts decreases in steps.
A table, below the four graphs, provides information about the device, the kernel, and the kernel occupancy. In the Kernel Occupancy section, you can see the limits imposed by each kernel resource, as well as which resource is currently limiting the number of waves for the kernel dispatch. This section also displays the kernel occupancy percentage.