

The CodeXL CPU Profiler uses the debug information generated by the compiler to show the correct function names in various analysis views and to attribute the collected samples to source statements in Source View. Otherwise, the results of the CPU Profiler would be less descriptive, displaying only the assembly code, and the functions would be reported as NO SYMBOL.
Generate Debug Information on Windows
When compiling an application in release mode, you can produce the debug information to enable CodeXL to perform an analysis. When using Microsoft Visual C++ to compile the application in release mode, set the following options to ensure that the debug information is generated and saved in a program database file(with a .pdb extension).
To set the compiler option to generate the debug information for a Win32 application in release mode:
1. Right click on the project and select Properties menu item.
2. In the Configuration list, select Active(Release).
3. In the Platform list, select Active(Win32).
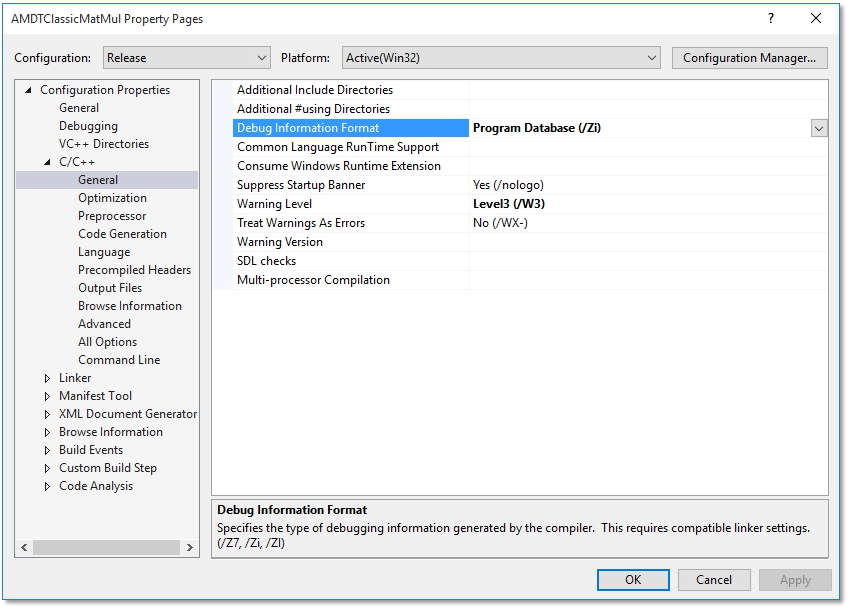
4. In the project pane, expand the Configuration Properties folder, then expand the C/C++ folder.
5. Select General.
6. In the work pane, select Debug Information Format, and from the drop-down list select Program Database (Zi) or Program Database for Edit & Continue (/ZI).
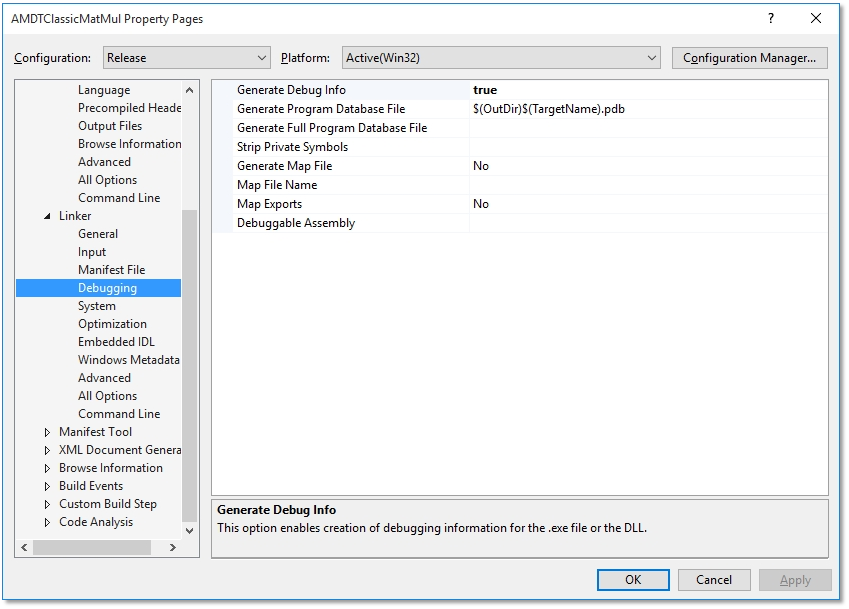
7. In the project pane, expand the Linker folder; then expand the Debugging folder.
8. In the Generate Debug Info list, select Yes (/DEBUG).
Generate Debug Information on Linux
The application must be compiled with the -g option to enable the compiler to generate debug information. Modify either the Makefile or the respective build scripts accordingly.