

Use the CodeXL Project Settings dialog to configure the current project CPU profile settings:
General Settings Page
To configure a specific application for profiling, enter the path to the application executable in the ‘Executable Path’ field.
This field can be left empty if you intend to perform System Wide profiling.
To profile a Java application:
· Enter the path of the Java runtime executable in the ‘Executable Path’ field, e.g. “C:\Program Files\Java\jre7\bin\java.exe”
· Enter the path of the java classes top folder in the “Working Directory” field, e.g. “C:\Scimark2”
· Enter the name of the main java class in the command line arguments, e.g. “jnt.scimark2.commandline”
The screenshot below shows an example of configuring a Java application for profiling.
Profile Settings Page
Click File -> Project Settings and select the Profile tree node.
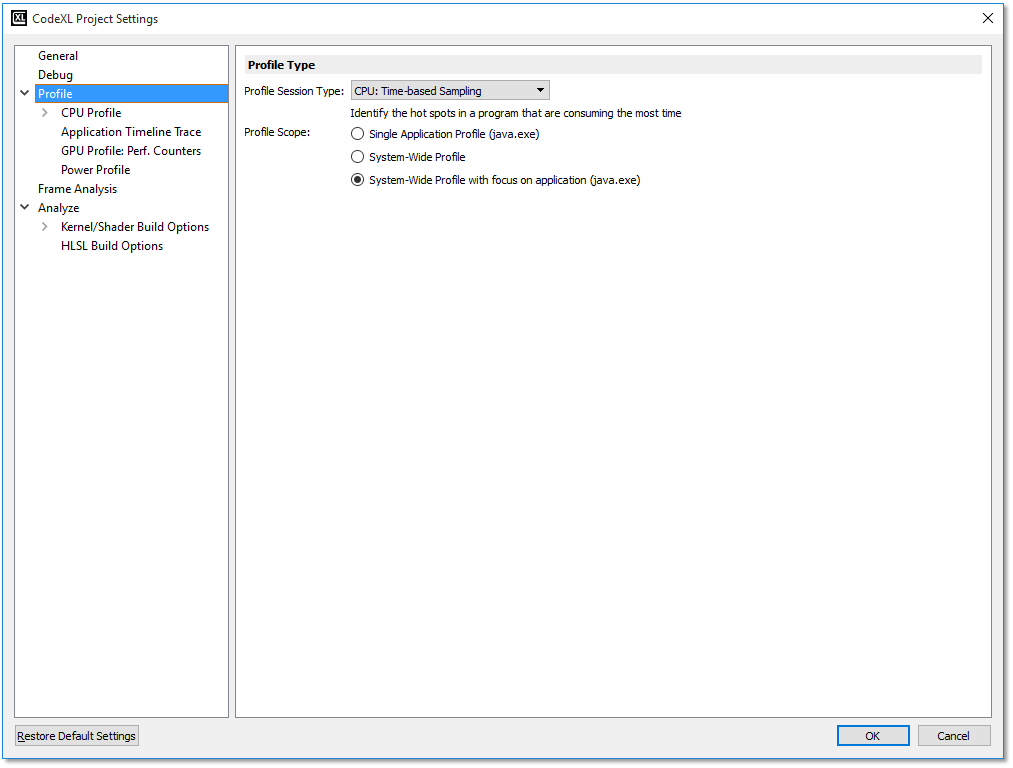
The “Profile Type” settings page will help you set the profile type of the current project and the profile scope:
|
Profile Session Type |
Displays the currently selected Profile Type. The combo box contains both CPU and GPU profile types. Use this to select which type of data you want to collect while running the next profile session. Use the text below the profile type combo box to get a description of each of the profile types. |
|
Profile Scope |
Defines the scope that the next profile session will monitor. Single Application – the profile session will collect data for only the profiled application (defined in the “General” settings page). System-Wide Profile – the profile session will collect data for each of the running processes in the system. System-Wide Profile with focus on application – the profile session will collect data for each of the running processes in the system. The profile session will also collect call stack details for the focused application (defined in the “General” settings page). |
CPU Profile Settings Page
Click Profile -> Profile Settings to open this settings page.
The CPU Profile settings page contains CPU profile specific configurations.
|
Collect call stack details |
Checking this option will set CodeXL to collect call stack details while profiling. Note: Call stack collection has higher overhead compared to sessions without call stack sampling, because stack unwinding is done whenever a sample is taken for the target process. The unwind operation, combined with the larger amount of data that must be written to the trace file, creates the higher overhead. Also, because of OS limits, the complete call stack might not be available. Set the appropriate “Call stack collection depth” and “Call stack every” options, to balance between performance overhead and statistical accuracy. |
|
Collect for code executed in |
Limits the collection of call stacks only for code running in User space, Kernel space or both (User space and Kernel space). |
|
Collect call stack every |
This parameter will define the frequency of call stack collection. |
|
Call Stack Collection Depth |
Defines the level of depth for the collected call stack. A higher depth will require performance overhead, but the data of the collected call stack will be more accurate. Options are: Minimal / Low / Medium / High / Maximal. Selecting one of these options will sample the call stack with an up to the depth of 2 / 32 / 64 / 128 / 392 levels. Note: This option is set separately for Time-Based Sampling and other CPU Profiling session types. |
|
Reproduce missing call stack info |
Perform additional analysis to overcome frame-pointer omission (FPO) in 32-bit apps and lack of unwind info in 64-bit. The profiler will store additional data during the profile session and require more time during post-session processing. Note: This option is set separately for Time-Based Sampling and other CPU Profiling session types. |
|
Collection Schedule |
Configures the schedule of collecting data during the profile session execution. Throughout entire duration – collect data throughout entire profile session execution Start profile with collection paused – the profile session will start with no data collection. Use the “Pause” button to resume data collection on the profiled application. Scheduled – set the specific timing for data collection during the execution of the profile session. |
|
Start data collection after |
Start data collection with a delay of ‘X’ seconds from the start of the profile session |
|
End data collection after |
When selected, the profile session data collection will end after ‘X’ seconds. |
|
Then, terminate the process |
When checked, after ‘X’ seconds selected to end the data collection after, the profiled process will be terminated by CodeXL. |
|
Profile hardware scope |
Use the tree structure of the existing hardware cores, or the affinity mask, to define the cores on which the profiled data will be collected. |
|
Restore Default Settings |
Restore the original default settings. |
CPU Profile Custom Settings Page
Click Profile -> Profile Settings to open this settings page. Select “Profile -> CPU Profile -> Custom” tree node to go to the custom settings page.
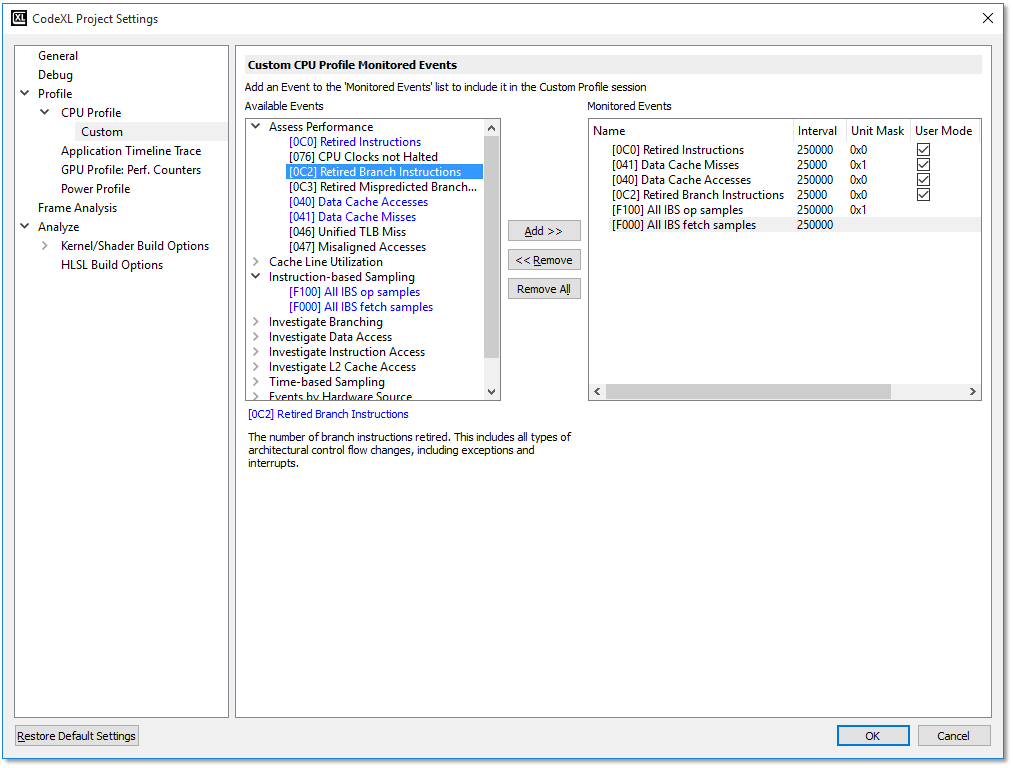
This settings page configures the list of events collected while running a session of type “Custom Profile”.
Available Events lists all the available events.
Monitored Events lists the events which are selected for monitoring.
Use Add, Remove, Remove All buttons to add the selected
event(s), remove the selected event(s), or remove all the selected events.
1. Some events have a checkbox:
o Usr Enables the collection of user-level samples for an event.
o Os Enables the collection of operating system-level samples for an event.
o Edge Enables the edge- and level- detection that control the way an event signal is sensed; this affects the way an event is counted in a performance counter.
The available events depend on the CPU hardware in your system. Note that only one Timer event, IBS all op samples event, or IBS fetch sample event can be monitored at a time.
|
Available Events |
Lists the available hardware events for profiling, nested within the configurations. |
|
Add / Remove buttons |
Adds to, or removes from the Monitored Events table the selected available event or configuration. |
|
Monitored Events |
A list containing the selected events for data collection in the “Custom Profile” sessions. A monitored event item in this list will contain: Name - The name of the monitored event. Interval – the period of how often a sample is to be taken (for counting occurring events). Unit Masks - Used to specify the unit mask setting for the selected event. Each bit set has a different meaning. The Event Settings pane gives you a description of the current setting. Usr - Enables collection of user-level samples for an event. Os - Enables collection of operating system-level samples for an event. Edge - Edge detection and level detection control the way an event signal is sensed; it affects the way an event is accumulated as a count in a performance counter. The occurrence of an event (a hardware condition) is asserted as a physical hardware signal. An event has a duration that can be as short as a single CPU clock cycle or it can be several cycles long. When OK is clicked and the Edge checkbox is checked, the "Custom Profile" configuration is selected automatically, and profiling can start immediately. |
Notable Available Events
|
[E000] Timer event |
Hardware APIC timer event. The default is 1ms. The minimum interval is 0.1ms. |
|
[F000] IBS fetch samples |
Determines how often an IBS fetch sample is taken. IBS fetch sampling counts completed fetches to determine when the next IBS fetch sample is taken. |
|
[F100] IBS all op samples |
Determines how often an IBS op sample is taken. When the Unit Mask is 0x0 (Count clock cycles), IBS op sampling counts processor cycles to determine when the next IBS op sample is taken. When the Unit Mask is 1 (Count ops dispatched), IBS op sampling counts dispatched ops to determine when the next IBS op sample is taken. Dispatched op counting is the preferred mode because profiles produced through cycle counting can be biased by instruction timing. |
|
Events by Hardware Source |
Performance monitoring counter events that vary according to the system's hardware. The individual descriptions are displayed when the event is selected. |
|
HardwareEventNotes Hardware Performance Counter Notes |
A hardware event can be added multiple times, but the unit mask, Usr, or Os settings must be different. When an available event or configuration is selected, a description is shown below the list. Most event details can be directly edited within the table by clicking on the detail to change. When an event is selected, the unit mask details are also shown below the Monitored Events table. The presence of a hardware condition is asserted when the event signal is high. Absence of the condition is asserted when the event signal is low. When edge detection is used, each low-to-high transition of the event signal is counted as a single event; that is, the performance counter is incremented by one. When level detection is used, the level is sensed during each clock cycle, and the performance counter is incremented by one for each cycle during which the event signal is asserted. The typical setting for an event is level-detect (the Edge box is unchecked). For example, if the event signal represents the "NOT HALTED" CPU state, then the performance counter counts the number of CPU clocks that the CPU spent in the "NOT HALTED" state. This configuration corresponds to the conventional "CPU Clocks Not Halted" event. Performance counters count either specific processor events or the duration of events. The "Dispatch Stalls" counter event, for example, measures the number of processor cycles when the instruction decoder has stalled for any reason. Edge detection and level detection can be used to determine the average number of cycles per stall by: · Counting the number of dispatch stall cycles (level detection). · Counting the number of dispatch stalls (edge detection). · Dividing the number of stall cycles by the number of stalls.
|