 CodeXL User Guide
The AMDT Activity Logger (previously named CLPerfMarkerAMD) library provides a simple host-code instrumentation API that can help you analyze your OpenCL applications.
It lets you instrument your code with calls to amdtBeginMarker() and amdtEndMarker (). These calls are then used by the GPU Profiler to annotate the host-code timeline in a hierarchical way.
The library also lets you instrument your code with calls to amdtStopProfiling() and amdtResumeProfiling() to control which parts of your application are profiled.
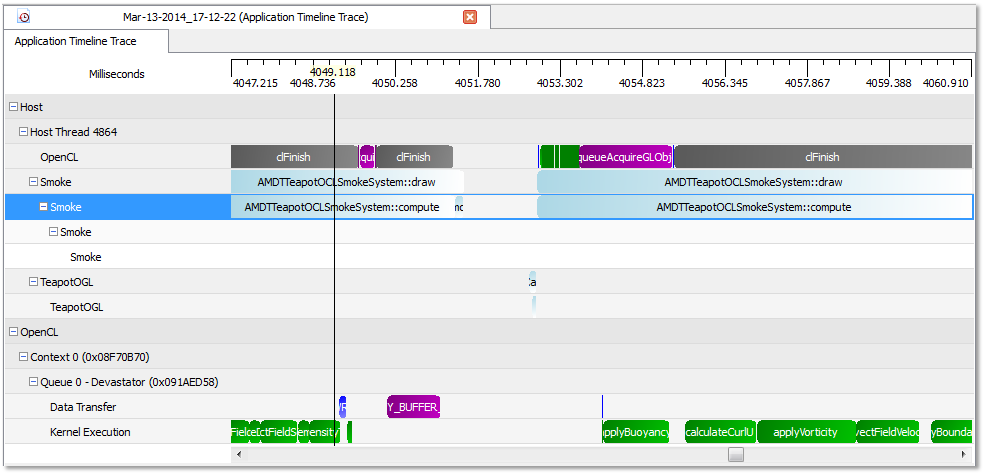
The following screenshot shows an application that has been instrumented with this API. In the image, the rows labeled Smoke and TeapotOGL under the Host Thread 4864 branch represent performance markers added to the host code.

For more information on this API, see the AMDTActivityLogger.pdf file in the AMDTActivityLogger/Doc subdirectory under the CodeXL installation directory.

