

The Current Work Item toolbar is shown during debugging. Use this toolbar to select the active thread.
When N-Dimensional kernel debugging is taking place (clEnqueueNDRangeKernel), use this toolbar to select the current work item.
· When looking at variables (watch view, locals view, hovering over the variable name), the values shown will be those relevant to this work item.
· When stepping through code, code locations where this work item is not valid will be skipped.
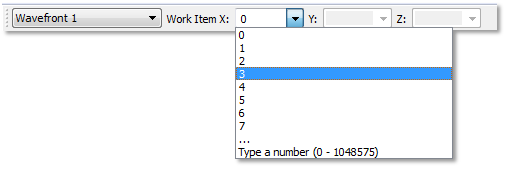
· For coordinates that have more than 8 work items, the last item in the drop down list will show the range of available work items (in the above example, there are 1048576 work items, with indexes ranging between 0 and 1048575).
· To reach a work item whose index is larger than 7, you need to type the index manually and press enter (or switch to another combo box). For example, if you want the X coordinate to be set on the index is 8192, you should type the string 8192 in the X combo box and press enter:

Thread / Wavefront Selection Combo-box
This combo-box contains a list of the host threads currently active in the debugged application. Selecting a thread shows its call stack in the Call Stack view.
During kernel debugging, the active wavefronts are also shown in this combo-box. Selecting a wavefront displays its kernel source call stack.
Note that when debugging with breakpoint emulation, all work-items are gathered in a single virtual wavefront, which does not represent the actual work-item distribution on the hardware.
X, Y, Z Combo-boxes
These combo-boxes are filled with valid values for the work-item coordinates (based on the global work offset and size). If the work dimension is too low, the combo-box is disabled (for example: Z in a 2-dimensional work).