 CodeXL User Guide
This view displays a log of OpenCL, OpenGL, OpenGL extensions, as well as WGL and glX function calls executed in each context.
Function Calls List
The function calls are displayed as a list, ordered by the time in which they were called. Each list line represents a single function call; it contains:
· the called function name,
· its arguments values, and
· the function type (as an icon).
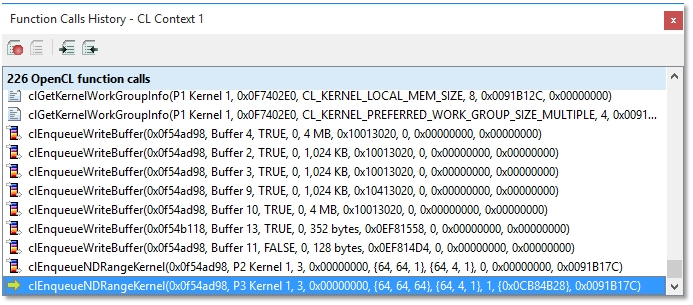
The function types are marked as shown in the following screenshot.

The icons have the following meanings
|
|
OpenCL function. |
|
|
OpenCL buffer and image function. |
|
|
OpenCL queue function. |
|
|
OpenGL function. |
|
|
OpenGL extension function. |
|
|
A WGL function. |
|
|
A GLX function. |
|
|
OpenGL program and shader function. |
|
|
OpenGL texture function. |
|
|
OpenGL buffer function. |
|
|
GL_string_marker_GREMEDY function. |
The Viewed Render Context
The list title bar shows the viewed context and the number of functions executed in it. Use the CodeXL Debugging Objects Explorer tree view to change the displayed context.
Breaked-On Function
A yellow arrow indicates the function called when the debugged process was suspended. Note that the process is suspended by CodeXL before the suspending function is executed. This lets you use the Step (F10) command to observe the effect its execution has on the API and objects.
Frame Terminators
When frame terminators are specified in the project settings, then during Frame Terminator execution the list in the context is cleared, and the function calls count is reset to 0.
Displaying Function Call Properties
Selecting a list line presents the appropriate function call in the Properties view.
HTML Log File
You can save the OpenCL / OpenGL function calls history in an HTML log file using the Record button. After pressing the Record button, a log file is created for each active context. This log file contains the details of each API function call, program and shader sources and image files for image and texture objects (if enabled in the Options dialog). To stop recording, press the record button again. To view the log file gathered so far, press the Open Current HTML Log File button.


