

The Call Graph view displays a list of functions with their Call Graph information, including caller-to-called relationship. This can be enabled or disabled from the Call stack collection check-box of the CPU Profile Project Options for a C++ based session. Call Graph is not supported for a CLR- or Java-based session.
Open Call Graph View
Open this view in one of the following ways.
· Double click the Call Graph node of a session. If the Call Graph view was already there, this opens the Call Graph view tab.

· Click the context menu item Display in Call Graph View of the functions table in the Profile Session Overview.

· Click the context menu item Open Call Graph of Call Graph node of a session Page. This opens the Call Graph view with that process selected. All the functions from that process are listed. This way of invoking Function view is possible only when multiple processes exist.

· Click the context menu item Display in Call Graph View of the functions table in the Profile Session Function View.

Tables in Call Graph View
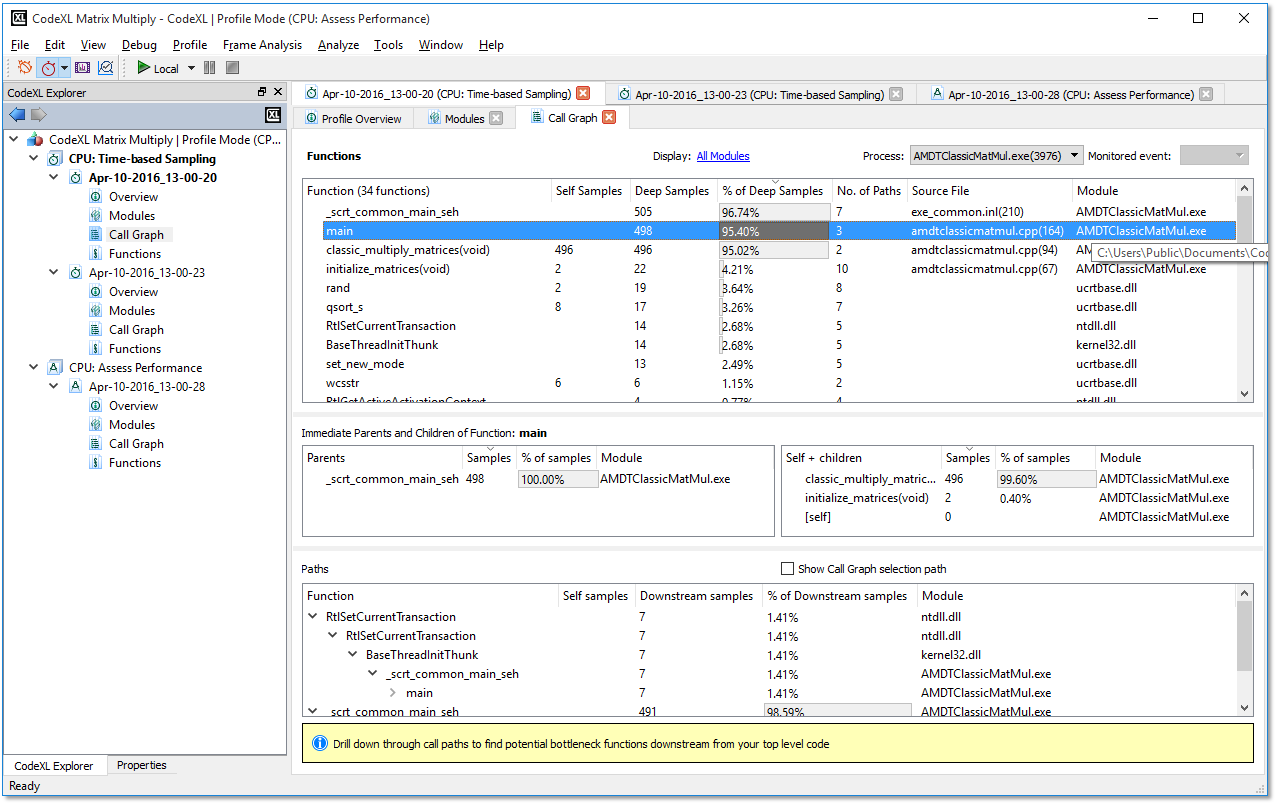
There are four tables in the Call Graph View.
· Function Table ‒ Appears at the top of the page and contains the list of all functions (of the selected process or all processes if All Processes option is selected).

This table has the following columns.
|
Function |
Function name that appeared in the call stack when the chosen monitored event triggered a sample collection. Based on the configuration of Display system modules in the Display Settings dialog, this includes the function from system modules. |
|
Self Samples |
This shows the number of times this function was on the top of call stack when the chosen monitored event triggered a sample collection. |
|
Deep Samples |
Number of times this function was present in the call stack when the chosen monitored event triggered a sample collection. |
|
% of Deep Samples |
Percentage of deep
samples out of the total count of the samples gathered |
|
No. of Paths |
Number of unique paths containing this function. |
|
Source File |
The source files containing the function. The line number is shown in parentheses. |
|
Module |
The name of the module that contains this function. Full path is available on tooltips text of the corresponding cell of the table. |
· Parent Table ‒ Appears on the left side of the two tables in the middle of the page. It shows the parents (the functions that call the current function) of the selected function in the function table. This table is updated when changing the selection on function table.

This table has the following columns:
|
Parents |
Lists all the function names that called the current function. In the call stack samples, those parents (direct ancestors) are immediately below the currently selected function. |
|
Samples |
The distribution of the currently selected function’s deep-samples between its parents. |
|
% of Samples |
Percentage of the paths samples from the total deep samples of the currently selected function. |
· Children Table ‒ Appears in the right side of two tables in the middle of the page. It shows the Children (the functions called by the current function) of the selected function in the function table. This table is updated on changing the selection on function table.

This table has the following columns:
|
Self + children |
Lists all of the function names called by the current function. In the call stack samples, those children (direct descendants) are immediately above the current function. It also lists one entry called [self]. This entry is on the selected function in the function table. |
|
Samples |
The distribution of the currently selected function’s deep-samples between its children. For the [self] function it is the self-samples (as there are no descendants to the function when it has been sampled itself). |
|
% of Samples |
Percentage of the paths samples from the total deep samples of the currently selected function. |
· Path Graph Table ‒ Represents the call chain in the form of a tree. In the tree, a child node represents a function called by the function represented by parent node.

This table has the following columns:
|
Function |
The names of functions represented in the call chain tree. |
|
Self samples |
Number of samples in this function. |
|
Downstream-samples |
From this point down in the path, not including the function samples. |
|
% of Downstream-samples |
Percentage of downstream-samples out of all samples for the specific call path. |
o Show Call Graph selection path – This checkbox controls whether to show a line that connects all the functions in the sub-tree that form a unique path, ending in the selected function. The small number at the end of the path’s line is the length of the path (starting with 0).
The path of the selected function is colored in yellow, while the path of the function on which the cursor is currently hovering above is colored in red.

Filters
· Processes ‒ List all the processes in process-name(process-id) format

It also has the All Processes option. If a process is selected in this combo-box, all the functions from that process are listed in the table. If All Processes is selected, then all the functions from all the modules of the current session are displayed in the current table.
· Monitored event ‒ Combo-box at the top right

This lists the set of monitored events observed during current profiling. Only the samples, that were collected when the event selected in this combo-box was triggered, are listed.
· Display Settings dialog ‒ Opened from the hyperlink-labeled Display above the table

Only one checkbox, Display system modules, is enabled when opened from Call Graph view, which is used to show/hide the system modules in the view.
Context Menu
The context menu provides the same information for each table discussed above, except Display Call Graph details, which are not available in the Function Table.

Context menu items consist of the following.
|
Open Source Code |
Opens the source code or disassembly view for the currently selected function in the current table. |
|
Display in Call Graph |
Opens the Call Graph view for the currently selected function in the current table. This menu item is not available for Function table. |
|
Display in Functions View |
Opens the Function view for the currently selected function in the current table. This menu item is not enabled for functions that are not present in Functions View (this can happen if the function was back-traced from another function (that may have been actually sampled), but not sampled – the monitored event was never triggered directly for that function). |
|
Copy |
Copies the selected column(s) in the current table, along with the headers to the clipboard. See the common context menu section. |
|
Expand All |
Expands all the nodes below the selected function’s node in the tree. |
|
Collapse All |
Collapses all the nodes below the selected function’s node in the tree. |