

The following panel shows the GPU performance counters for an OpenCL™ profile session. To get the .csv file of the result, right-click the session in the CodeXL Explorer, and select "Open Containing Folder" from the menu. See Description of Output Files for a detailed description of the format of this file.
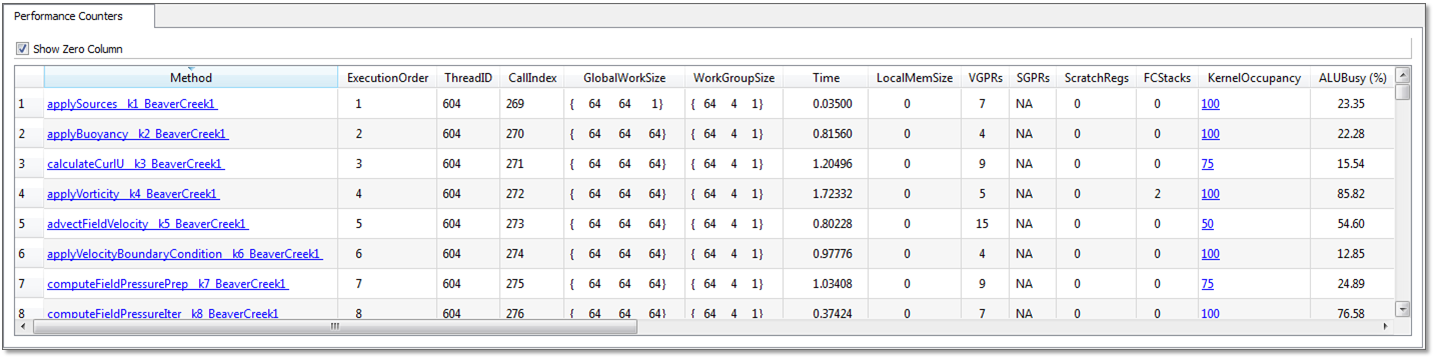
At the top of the panel, there is a ""Show Zero Columns"" checkbox. When checked, the session table shows all columns. When unchecked, any column that has a zero or empty value for every row is hidden.
The first several columns in the session are always displayed, even if no performance counters are selected for the profile. A description of these columns for OpenCL™ applications is given in the following table.
|
Name |
Description |
|
Method |
The kernel name (appended with __k[KernelID]_[DeviceName][DeviceID] to differentiate unique kernels with the same name). |
|
ExecutionOrder |
The order of execution for the kernel dispatch operations in the program. |
|
ThreadID |
The thread ID of the host thread that made the OpenCL™ API call that initiated the kernel dispatch operation. |
|
CallIndex |
The call index of the OpenCL™ API call that initiated the kernel dispatch operation. |
|
GlobalWorkSize |
The global work-item size of the kernel. |
|
WorkGroupSize |
The work-group size of the kernel. |
|
Time |
The time spent (in milliseconds) executing the kernel. This does not include the kernel set-up time. |
|
LocalMemSize |
The amount of local memory (LDS for GPU) in bytes being used by the kernel. |
|
VGPRs |
The number of general-purpose vector registers used by the kernel (valid only for GPU devices). |
|
SGPRs |
The number of general-purpose scalar registers used by the kernel (valid only for GPU devices). |
|
ScratchRegs |
The number of scratch registers used by the kernel (valid only for GPU devices). If non zero, this typically is the main bottleneck. To reduce this number, reduce the number of GPRs used by the kernel. |
|
KernelOccupancy |
The kernel occupancy (valid only for GPU devices). This is an estimate of the number of in-flight wavefronts on a compute unit as a percentage of the theoretical maximum number of wavefronts that the compute unit can support. |
The following table gives a description of these columns for an HSA application.
|
Name |
Description |
|
Method |
The kernel name (appended with the Device Name). |
|
ExecutionOrder |
The order of execution for the kernel dispatch operations in the program. |
|
ThreadID |
The thread ID of the host thread that made the HSA API call that initiated the kernel dispatch operation. |
|
GlobalWorkSize |
The global work-item size of the kernel. |
|
WorkGroupSize |
The work-group size of the kernel. |
|
LocalMemSize |
The amount of local memory (LDS) in bytes being used by the kernel. |
|
VGPRs |
The number of general-purpose vector registers used by the kernel. |
|
SGPRs |
The number of general-purpose scalar registers used by the kernel. |
|
KernelOccupancy |
The kernel occupancy. This is an estimate of the number of in-flight wavefronts on a compute unit as a percentage of the theoretical maximum number of wavefronts that the compute unit can support. |
The following table gives a description of these columns for a DirectCompute application.
|
Name |
Description |
|
Identifier |
The kernel name (appended with a pointer value that is unique for each kernel instance) or the data transfer operation name. |
|
ExecutionOrder |
The order of execution for the kernel and data transfer operations from the program. |
|
ThreadGroup |
The thread group size of the kernel. |
|
WorkGroupSize |
The work-group size of the kernel. |
|
Time |
For a kernel dispatch operation: time spent (in milliseconds) executing the kernel; does not include the kernel setup time. For a data transfer operation, time spent (in milliseconds) transferring data. |
The GPU Profile: Performance Counters page of the GPU Profiling Project Settings contains the description of the performance counters. This description is also shown if you hover the mouse cursor over the counter name in the Session panel.
To show the source, IL, or ISA code of an OpenCL™ kernel, or the DXASM code of a DirectCompute kernel, click on the kernel name in the first column to open the GPU Profiler Code Viewer.
For OpenCL™ applications, if a kernel is run on a CPU device, only the global work size, work group size, local memory, and the execution time for the kernel is available.
Using the performance counters lets you:
· Find the number of resources (general-purpose registers, local memory size, and flow control stack size) allocated for the kernel. These resources affect the possible number of in-flight wavefronts in the GPU. A higher number can hide data latency better.
· Determine the number of ALU, global, and local memory instructions executed by the GPU.
· Determine the number of bytes fetched from, and written to, the global memory.
· Determine the use of the SIMD engines and memory units in the system.
· View the efficiency of the shader compiler in packing ALU instructions into the VLIW instructions used by AMD GPUs.
· View any local memory (local data share - LDS) bank conflicts.
· View Kernel occupancy percentage , which estimates the number of in-flight wavefronts on a compute unit as a percentage of the theoretical maximum number of wavefronts that the compute unit can support.
To view more information about the kernel occupancy figure for an OpenCL™ kernel, click on the percentage value in the Kernel Occupancy column to open the GPU Profiler Kernel Occupancy Viewer.
Note: Special case when other workloads are using the GPU while profiling
When collecting performance counters, it is strongly recommended that no other workloads (i.e. graphics workloads) are running on the GPU. Performance counters on AMD Radeon™ GPUs are global in nature, meaning that graphics workloads running on the GPU concurrently with a compute workload that is being profiled can affect the counter values reported. It is recommended that all other applications are closed before profiling. Note: The Windows user interface itself uses the GPU for rendering and it may not be possible to disable this. Because of this, there may be some rare occurrences where the counters for a particular kernel dispatch may be incorrect.
Note: Special case when an OpenCL™ kernel uses printf
When profiling an OpenCL™ kernel that contains one or more printf calls, the Performance Counter results will show values as if the kernel was dispatched with a single wavefront (regardless of how many actual wavefronts are launched). This is due to the way printf is implemented in the OpenCL runtime. When a kernel contains printf, internally, the runtime dispatches each wavefront separately. It is recommended that you remove all printf statements from a kernel before you attempt to profile it.