

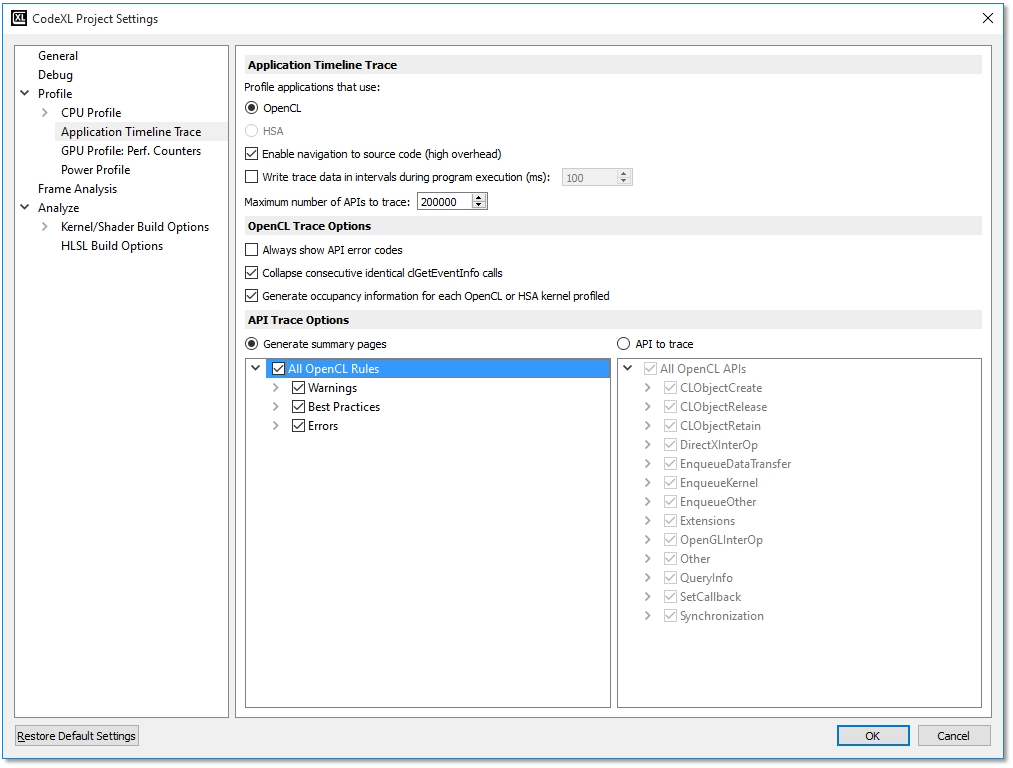
This page lets you configure the behavior of the Profiler when it performs an application timeline trace.
Application Timeline Trace settings page
|
Profile applications that use |
Select the API to trace. When one of the OpenCL / HSA radio buttons is clicked, the project setting pages will display the options relevant to the selected API. |
|
Enable navigation to source code (high overhead) |
When checked, the Profiler generates a symbol information file from an application's debugging information (the .pdb file on Windows), containing one entry for each called OpenCL™ API. This symbol information file lets you navigate from an item in the API Trace in the Application Timeline Trace Session panel to the source location of the API call. |
|
Write trace data in intervals during program execution (ms) |
When selected, the Profiler periodically writes all queued trace data to disk during program execution. The interval (in milliseconds) at which to write trace data is specified using the value following the checkbox. When checked, in addition to writing data periodically, the Profiler also writes all queued trace data when the clReleaseContext OpenCL™ API is called. However, if an application does not call clReleaseContext, or if it calls any OpenCL™ APIs after the final clReleaseContext call, then it is possible that not all trace data is written to the disk. When unchecked, all trace data is written to disk when the application terminates. On Linux, this is the default (and only supported) mode for writing trace data. Thus on Linux, the UI lets you specify the interval but does not let you enable or disable writing the data in intervals. |
|
Maximum number of APIs to trace |
This controls how many APIs are traced over an application's lifetime. The default number of APIs to trace is 1 million. Limiting the number of APIs traced helps to prevent running out of memory while profiling. After the limit is reached, no additional APIs is traced, and the trace results do not include any additional information. Because of this, any information provided in the GPU Profiler Summary Pages might not be correct, as a complete trace is required to provide a fully-accurate application summary. |
|
Always show API error codes |
When checked, the Profiler reports the return codes for all OpenCL™ API calls. Some OpenCL™ API functions return an error code through a passed-in parameter. If the host application passes in NULL for that parameter, then the OpenCL™ runtime does not report an error code. The Profiler substitutes a non-null parameter in this case, and the API Trace can show the return code. |
|
Collapse consecutive identical clGetEventInfo calls |
Some OpenCL™ applications wait for certain Enqueue API calls to complete by continuously checking the status of the event returned by the Enqueue API. These applications do this by calling clGetEventInfo within a loop until the event status reaches a certain state (typically CL_COMPLETE). For these applications, the timeline and API trace can contain thousands of clGetEventInfo calls, making it difficult to easily analyze the timeline and trace data. To make analysis easier, the Profiler can collapse consecutive clGetEventInfo calls that have the same parameters and return values into a single entry in the timeline and API trace. |
|
Generate occupancy information for each OpenCL kernel profiled |
When checked, the Profiler generates kernel occupancy data for each OpenCL™ kernel dispatched to a GPU device. |
Generate summary pages
When checked, the Profiler automatically generates GPU Profiler Summary Pages using the API trace and timeline data. You can further configure the summary pages by selecting rules to be used when generating the Warning(s)/Error(s) Summary page. The following table shows the currently supported rules.
|
Rule |
Description |
API |
|
Tracks the reference count for all OpenCL™ or HSA objects, and reports any objects not released |
OpenCL / HSA |
|
|
Detect deprecated API calls |
Detects calls to OpenCL™ API functions that have been deprecated in recent versions of OpenCL™ |
OpenCL |
|
Detect unnecessary blocking writes |
Detects unnecessary blocking write operations |
OpenCL |
|
Detect non-optimized work size |
Detects clEnqueueNDRangeKernel calls that specify a global or local workgroup size that is non-optimal for AMD Hardware |
OpenCL |
|
Detect non-optimized data transfer |
1. Detects non-Fusion
APU access to Device-Visible Host Memory directly |
OpenCL |
|
Detect redundant synchronization |
Detects redundant synchronization that results in low host and device use |
OpenCL |
|
Detect failed API calls |
Detects OpenCL™ API
calls that do not return CL_SUCCESS. Some of the return codes from OpenCL™ APIs might not be detected unless the Always show API error codes option is checked |
OpenCL / HSA |
· APIs to trace When checked, you can tell the Profiler which APIs you want traced. By limiting the APIs to trace, you can focus attention on particular APIs when analyzing trace data while also reducing the overhead of performing a trace. Because a full trace is required in order to generate the Summary pages, this option is mutually exclusive with the Generate summary pages option. Use the treeview below the option to select the APIs for the Profiler to trace.