 CodeXL User Guide
CodeXL GPU debugging supports OpenCL kernel debugging. In order to step into a kernel, and start debugging, use one of the following methods:
1. Breakpoint in clEnqueueNDRangeKernel
2. Break in a kernel
Breakpoint in clEnqueueNDRangeKernel
1. Put a breakpoint in clEnqueueNDRangeKernel using the breakpoints dialog.
2.
Once the breakpoint hits, click
F11, or step-in button 
3. The kernel source file is opened, and you can use step-over, step-in and step-out buttons.
Break in a kernel
1. Run your application.
2. After the kernel is created, break into the debugger.
3. Open the breakpoints dialog.
4. Navigate to the “Kernel Functions” tab
5. Select the kernel in which you want to break, and click the “Add button”.
6. Click Ok.
7. Resume the debugged application.
8. Next time this kernel is executed, the kernel source file will open, and you will be able to use step-over, step-in and step-out buttons.
Kernel Debugging
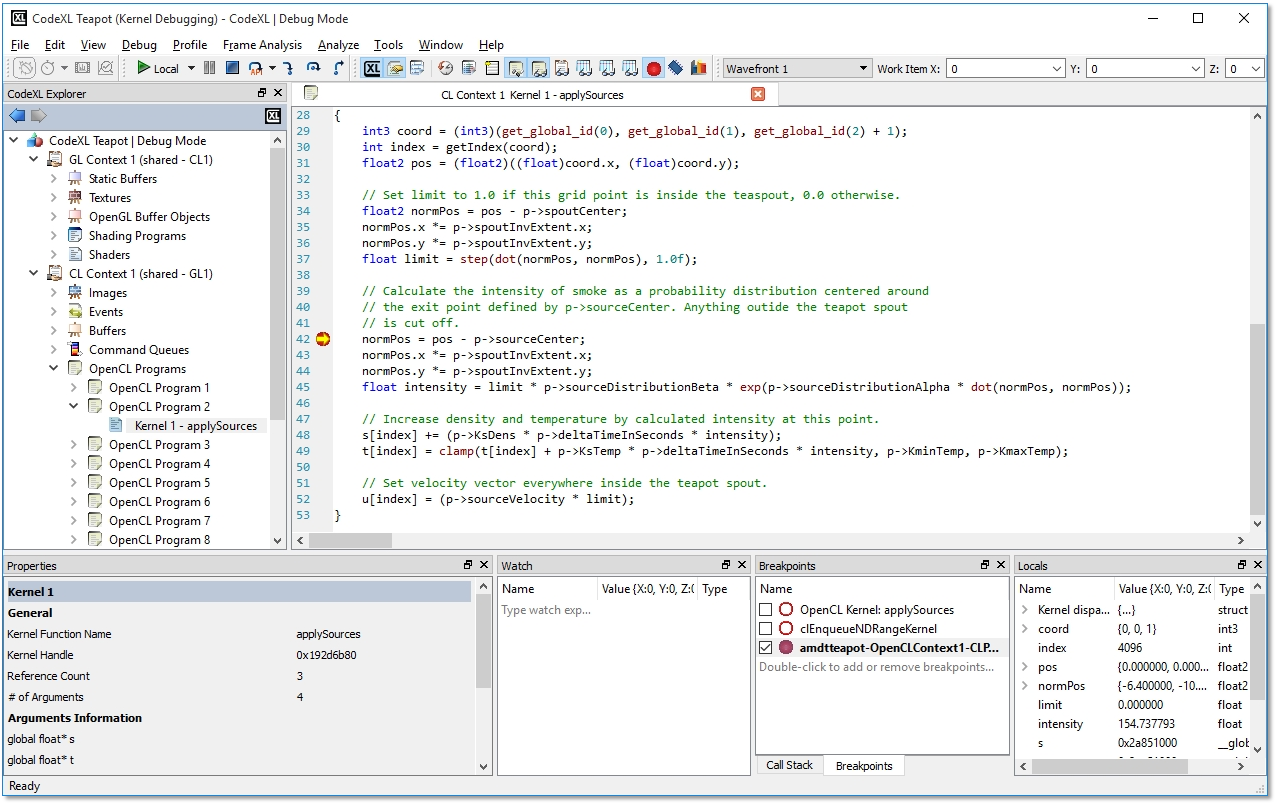
Once CodeXL goes into kernel debugging mode, the kernel source code is opened. If the kernel was created with a string, a temporary file with the kernel source is created.

While debugging the kernel you can:
1. Put a breakpoint in any of the kernel source code lines.
2. Step-in, Step-out and Step-over the kernel source code lines.
3. See the values of variables in various views:
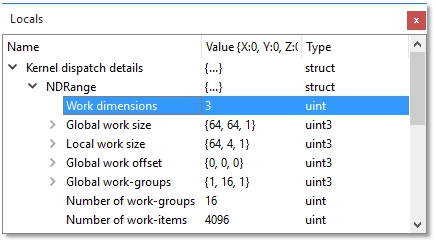
The locals view display a tree of the current local variables.

· Watch view
Type an expression, or drag an expression from the source code view to see the current variable value.

Use the work item toolbar in order to change the currently viewed work item both in Watch view and Locals view.

· Multi-watch view
In order to see multiple work item view of a variable, open the Multi-watch view and use the visual and numeric data representation to see the variable’s values.
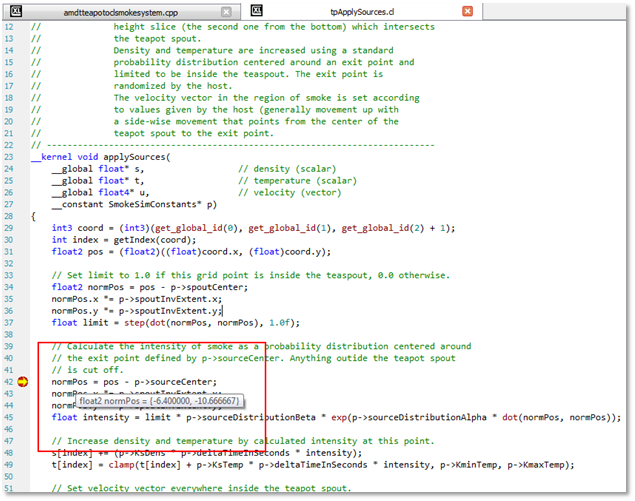
· Use the mouse to hover a variable and watch its value in a tooltip
As seen in the attached screenshot, once CodeXL is in Kernel Debugging mode, when the mouse cursor hovers over the variable name, a tooltip with the variable value is displayed.


