View Statistical Information About API Usage
Open the CodeXL Statistics view. The best way to overview your application's API usage is to collect the statistics for a few complete frames. Let your application run for a few frames, then suspend it by pressing Break All (F6). If you are using frame terminators, press the Step Out button (Shift+F11) to advance to the end of the current frame. Alternatively, set a breakpoint on a frame terminator, and Continue (F5) past it a few times to collect enough information. This gives you the clearest statistical information about your API usage. To change between the statistics for different OpenCL and OpenGL contexts, choose them in the CodeXL Explorer.
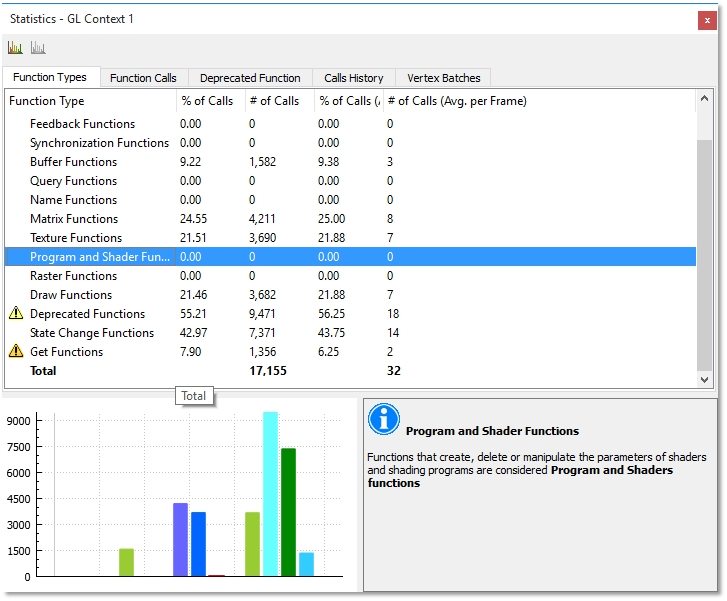
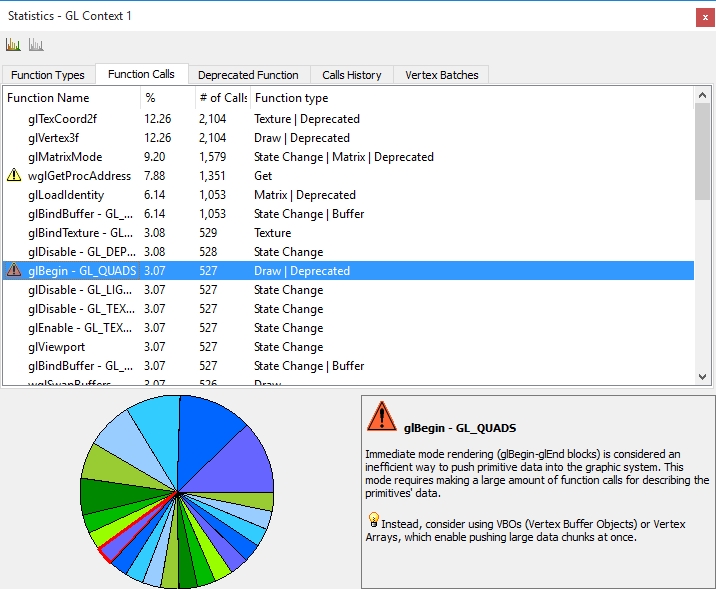
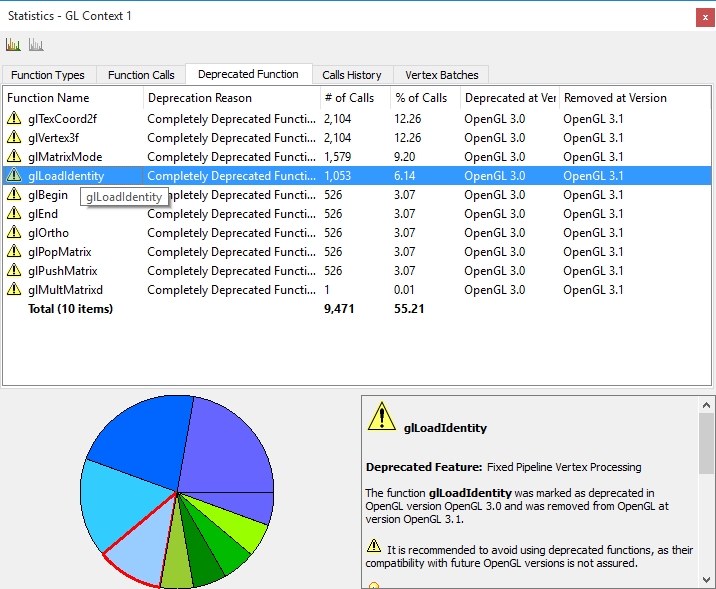
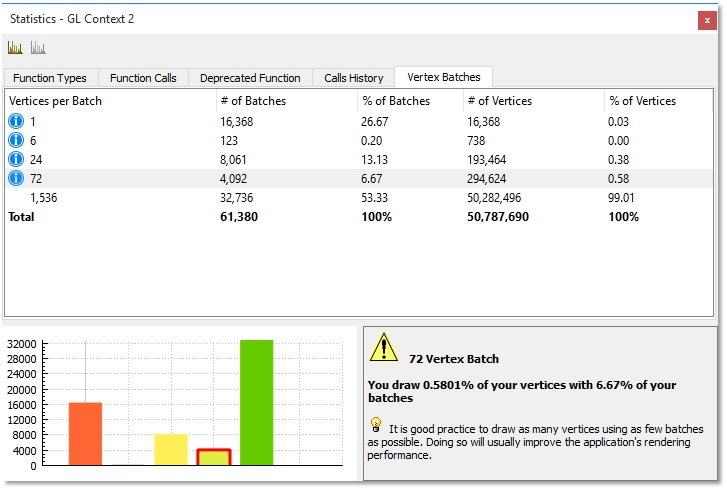
The Function Types Statistics tab shows your OpenCL and OpenGL usage by function types. The percentages here do not always add up to 100% because an API function can belong to many or none of the categories. In the Function Calls Statistics tab, you can see details of specific functions, including the function types each function belongs to. In the Vertex Batch Statistics tab, you can see details of your application's vertex batches by size, giving an overview of the vertex sizes and occurrence, as well as the total number of vertices drawn with each batch size.
Kernel Debugging
On AMD GPU hardware ,CodeXL allows debugging OpenCL kernels in real time on AMD GPU hardware, with only a single machine and single device, and with hardware results.
Enter Kernel Debugging
There are three ways to enter kernel debugging:
·
After starting debugging and suspending
the process (with Break / F6 or an API function breakpoint), use the Step
command or an API function breakpoint to get to an API call of
clEnqueueNDRangeKernel or clEnqueueTask. Then, press Step Into (F11) to start
debugging the kernel.
·
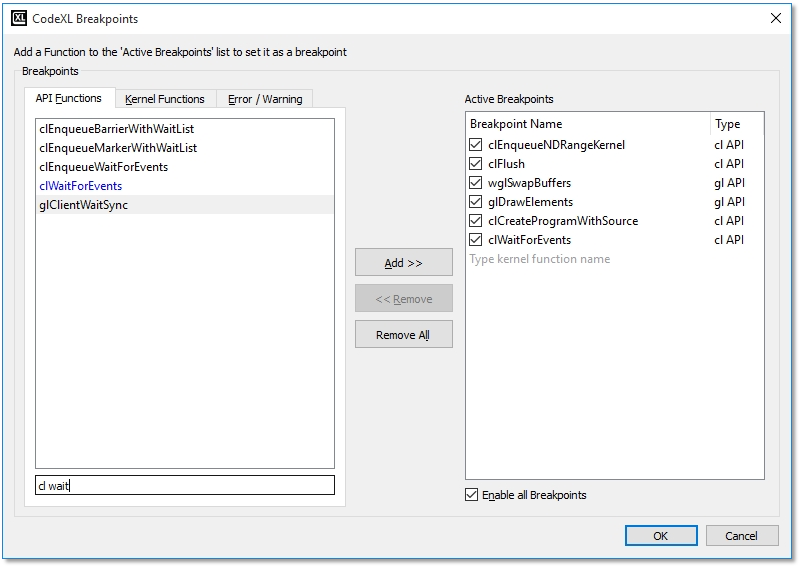
Add the kernel function name as a
kernel function breakpoint in the breakpoints dialog (Alt+Shift+B), by
switching to the Kernel Functions tab or by manually typing in the kernel name
in the Active Breakpoints list. When a kernel matching the function name starts
executing, the debugged process stops at the kernel’s beginning.
· From the CodeXL Explorer view, open the OpenCL program, and set a breakpoint inside the code. The application stops inside the kernel when it hits the breakpoint.
Kernel Debugging Control
While in kernel debugging, press step over (F10) to step to the next line in the same scope, step in (F11) to enter functions called inside the kernel, or step out (Shift+F11) to leave the current function or kernel.
You can also set kernel source breakpoints by selecting a line in the kernel and pressing Add Breakpoint (F9), or clicking in the margin next to the line. Press Continue (F5) to run up to the breakpoint. You can also set a breakpoint inside a function to enter that function (as with stepping in).
Focus On a Specific Work-Item
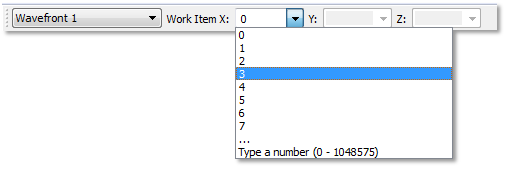
CodeXL's Current Work-Item toolbar lets you select a single work-item to focus on in CodeXL. If the toolbar is not open, right-click in the toolbars area, and select it from the dropdown menu. The combo-boxes for X, Y, and Z coordinates are enabled and offer values depending on the currently debugged kernel's N-Dimensional global work size. Selecting a work-item has the following effects:
·
The locals and Watch views display
variable values for this work-item.
·
When stepping through kernel debugging,
"if" or "else" clauses not entered by the selected work-item
are skipped.
· The work-item is selected in the MultiWatch views.
Inspect Variable Values
Use the Local and Watch views to inspect variable values. The Locals view displays all variables that are currently in-scope. Use the Watch view to dereference pointers (*p) or access array members (a[150]).
The values shown in all these views are the at the current work-item, as selected by the current work-item toolbar.
Compare Variable Values Across Work-Items and Work-Groups
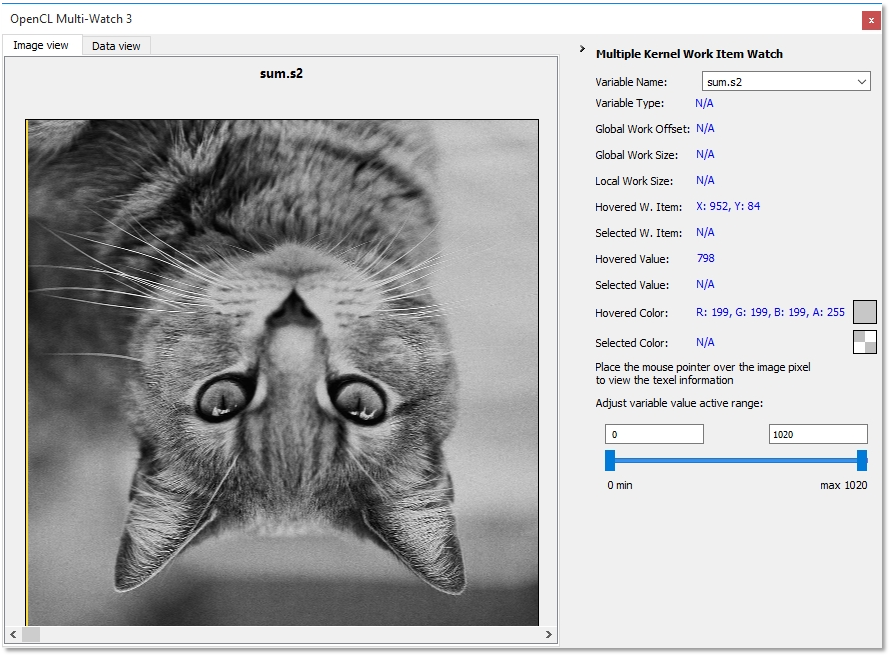
Use CodeXL Multi-Watch views to compare the values of variables across various work-items and work-groups. To open a Multi-Watch view, select it from the Views toolbar or menu, or right-click a variable and select "OpenCL Multi-Watch...". The view's variable selection combo-box offers all variables that can be viewed (similar to the Locals view list). Select a variable to view its values. The main view displays a spreadsheet or graphical representation of the values along a sliding scale ranging from the lowest value to the highest. Move the pointers in the Active Range slider to quickly highlight values outside a given range.
In Data (spreadsheet) view, the variable values are placed into cells according to their work-item coordinates. Work-groups are alternately colored white and gray, letting you easily see the edge of a work-group.
In Image view, variables inside the range are colored on a gradient scale from black (lowest) to white (highest). Values below the range are red; values above the range are purple; work-items that are out of scope are yellow.
For three-dimensional work sizes, use the Z coordinate slider to navigate between the various XY planes in the global work.
The "hovered" controls display the location, value, and color for the mouse cursor's location. Click the view to set the current values to the "selected" control for an easy comparison against a single work-item. This also centers the Data view on the selected item.