

A graphics frame can be very busy and contains tens of thousands of API calls. The following buttons and UI elements are useful in navigating the frame timeline and highlighting API calls of interest:
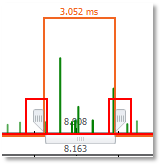
Focused Timeline Fragment
Use the left and right handles to expand/reduce the focused timeline fragment in and out:
The navigation bar drop-list contains 3 visualization aids:
· Duration
· Count
· Concurrency
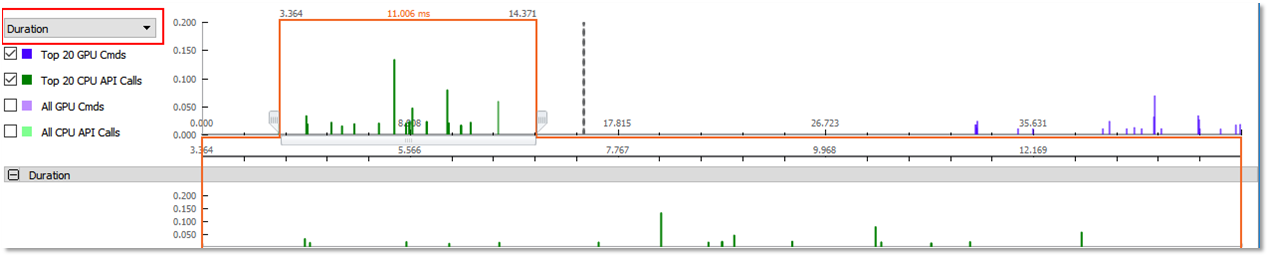
API Calls Duration
Select “Duration” in the top left combo box, to view the duration of API calls:
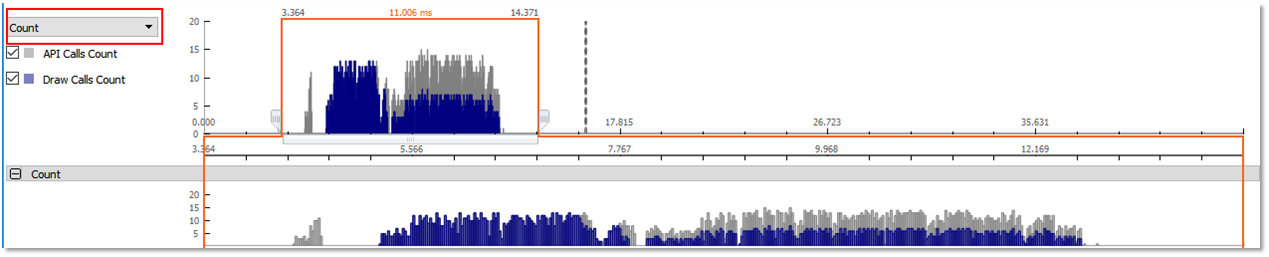
Select “Count” in the top left combo box, to view the API calls count for each time fragment:
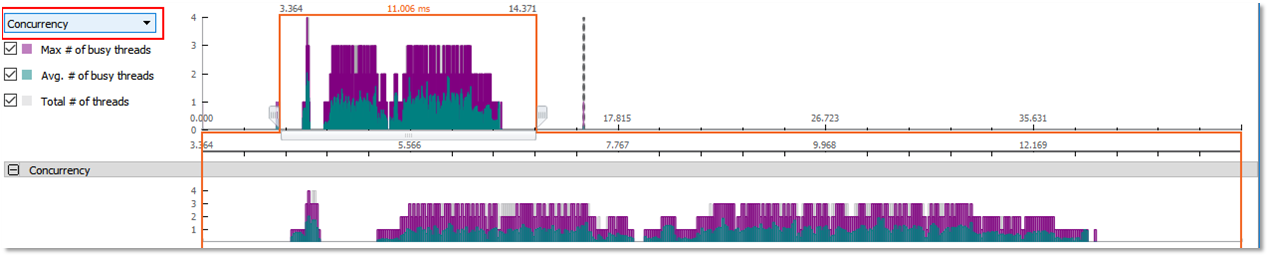
API Calls Concurrency
Select “Concurrency” in the top left combo box, to view the max / average busy threads concurrency over the frame timeline:
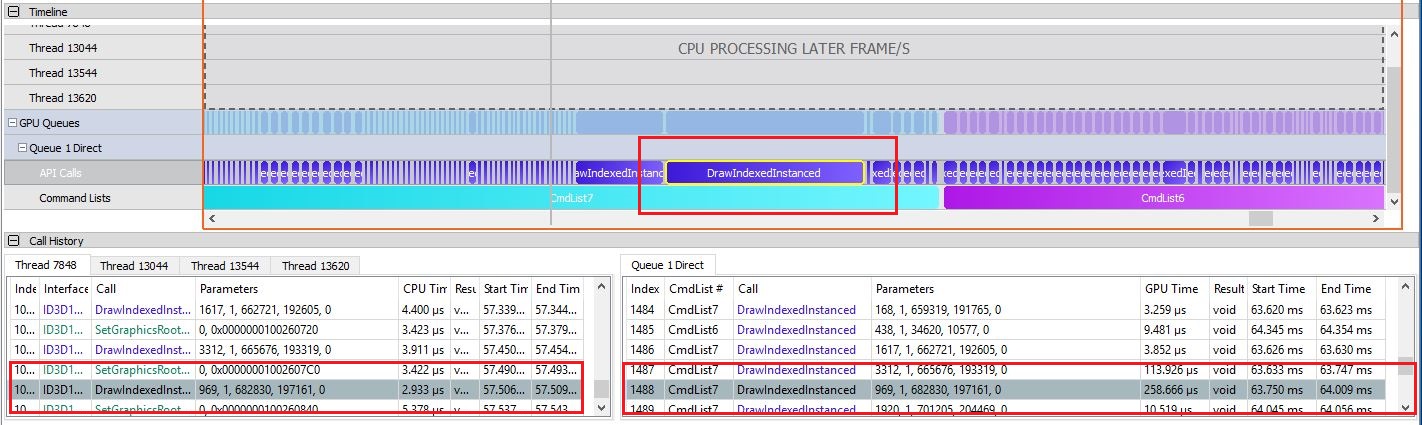
Timeline chart and API Calls tables
Double click a CPU API table item, and the timeline chart will zoom to the corresponding timeline item and highlight it. If there is a linked GPU API item, it will also be highlighted in the GPU API table
Hotspot Summary Tables
The bottom ribbon of the timeline view contains the Hotspot Summary tables. These tables display aggregated data for API calls and command lists \ buffers, showing statistics for each type of API and the top individual calls to that API type.
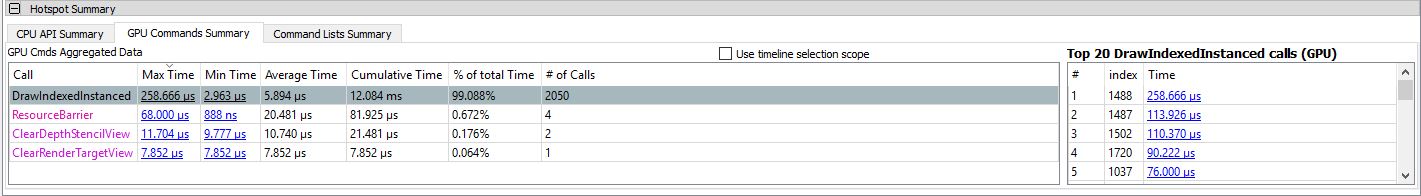
The Max Time and Min Time columns display the execution time of the longest and shortest API call of the selected API type. These are also direct links – clicking them causes the API tables and timeline chart to display the individual call item.
The ‘Top 20’ table is automatically populated with the 20 longest calls of the API type selected in the API summary table.
Performance tip: The longest GPU command in the frame, is always the first API call in the Top 20 table when the timeline view is opened.
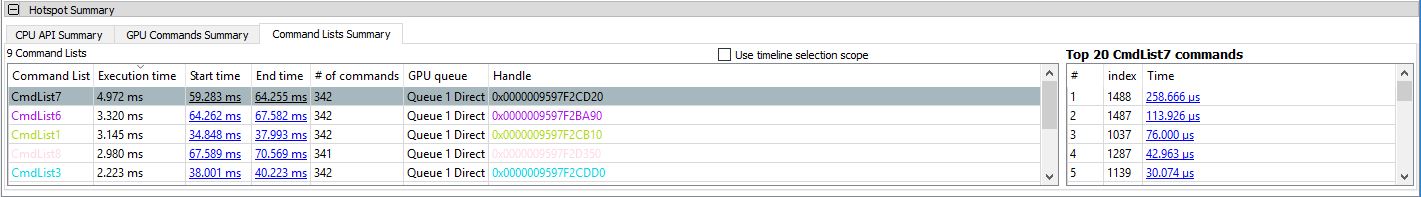
For command lists \ buffers the hotspot table displays the command lists \ buffers which were executed during the captured frame.
The Execution Time column displays the execution time of the longest and shortest command lists \ buffer. The start and end time are also direct links – clicking them causes the timeline chart to display the individual command list \ buffer.
The ‘Top 20’ table is automatically populated with the 20 longest GPU call which belongs to the command list \ buffer which is selected in the hotspot summary table.
Performance tip: The longest GPU command in the frame, is always the first API call in the Top 20 table when the timeline view is opened.