

The GPU Profiler Summary Pages show the statistics for your OpenCL™ or HSA application. They can provide you with a general idea of the location of the application's bottlenecks. They also provide information such as the number of buffers and number of images created on each context (for OpenCL™), the most expensive kernel call, etc. One Summary Page, the "Warning(s)/Error(s)" page, shows the result of a rule-based analysis of the API trace and timeline data. You can sort each column in a summary page by clicking the table header. You also can rearrange the columns by dragging them to a new location. By default, the Summary Pages are generated when performing an Application Trace profile from CodeXL. You can control whether the Summary Pages are generated by changing the settings on the Application Timeline Trace page. To generate summary pages from the command line, see Using the Command Line Interface. You can find summary pages under the same directory as the .atp file. You can view each summary page in your default web browser because all summary pages are in html format.
API Summary Page
The API Summary page
shows statistics for all OpenCL™ or HSA API calls made by the application. This
page can help to identify any API hotspots.
|
API Name |
# of Calls |
Total Time(ms) |
Ave Time(ms) |
Max Time(ms) |
Min Time(ms) |
|
clSetKernelArg |
60884 |
106.42239 |
0.00175 |
0.07284 |
0.00147 |
|
clGetKernelInfo |
4332 |
8.29252 |
0.00191 |
0.02347 |
0.00147 |
|
clEnqueueNDRangeKernel |
4332 |
178.09443 |
0.04111 |
0.19556 |
0.00831 |
|
clReleaseMemObject |
4265 |
537.25810 |
0.12597 |
1.07458 |
0.00147 |
|
clCreateBuffer |
4265 |
13.41322 |
0.00314 |
0.05622 |
0.00195 |
|
clEnqueueReadBuffer |
938 |
2403.70320 |
2.56258 |
18.78409 |
0.60280 |
|
clEnqueueWriteBuffer |
231 |
318.01591 |
1.37669 |
10.39231 |
0.78809 |
|
clEnqueueWriteBufferRect |
63 |
1286.34994 |
20.41825 |
63.08036 |
13.78178 |
|
clEnqueueReadBufferRect |
63 |
4288.33441 |
68.06880 |
134.18926 |
45.09560 |
|
clReleaseKernel |
13 |
0.03764 |
0.00290 |
0.00440 |
0.00244 |
|
clCreateKernel |
13 |
0.06600 |
0.00508 |
0.00880 |
0.00293 |
|
clGetDeviceInfo |
11 |
0.03422 |
0.00311 |
0.00391 |
0.00244 |
|
clGetPlatformInfo |
5 |
0.02396 |
0.00479 |
0.00635 |
0.00293 |
|
clGetContextInfo |
4 |
0.02396 |
0.00599 |
0.01613 |
0.00196 |
|
clReleaseContext |
2 |
0.00831 |
0.00415 |
0.00587 |
0.00244 |
|
clCreateContextFromType |
2 |
0.06844 |
0.03422 |
0.04547 |
0.02298 |
|
clReleaseProgram |
1 |
2.08413 |
2.08413 |
2.08413 |
2.08413 |
|
clReleaseCommandQueue |
1 |
97.29672 |
97.29672 |
97.29672 |
97.29672 |
|
clFinish |
1 |
0.06307 |
0.06307 |
0.06307 |
0.06307 |
|
clCreateProgramWithBinary |
1 |
0.58276 |
0.58276 |
0.58276 |
0.58276 |
|
clCreateCommandQueue |
1 |
227.11189 |
227.11189 |
227.11189 |
227.11189 |
|
clBuildProgram |
1 |
1492.02943 |
1492.02943 |
1492.02943 |
1492.02943 |
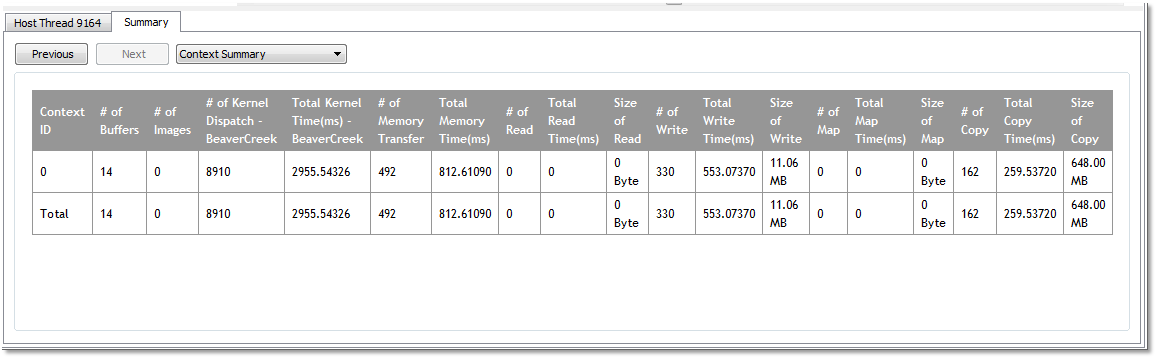
OpenCL™ Context Summary Page
The Context summary page shows the statistics for all the OpenCL™ kernel dispatch and data transfer operations for each context. It also shows the number of buffers and images created for each context.
|
Context ID |
# of Buffers |
# of Images |
# of Kernel Dispatch - CPU_Device |
Total Kernel Time(ms) - CPU_Device |
# of Kernel Dispatch - Juniper |
Total Kernel Time(ms) - Juniper |
# of Memory Transfer |
Total Memory Time(ms) |
# of Read |
Total Read Time(ms) |
Size of Read |
# of Write |
Total Write Time(ms) |
Size of Write |
# of Map |
Total Map Time(ms) |
Size of Map |
# of Copy |
Total Copy Time(ms) |
Size of Copy |
|
0 |
2 |
0 |
1 |
69.07170 |
1 |
4.10271 |
2 |
1.08503 |
0 |
0 |
0 Byte |
2 |
1.08503 |
512.00 KB |
0 |
0 |
0 Byte |
0 |
0 |
0 Byte |
|
1 |
2 |
0 |
1 |
35.53000 |
NA |
NA |
1 |
0.21951 |
0 |
0 |
0 Byte |
1 |
0.21951 |
256.00 KB |
0 |
0 |
0 Byte |
0 |
0 |
0 Byte |
|
2 |
2 |
0 |
NA |
NA |
1 |
3.41856 |
1 |
0.68449 |
0 |
0 |
0 Byte |
1 |
0.68449 |
256.00 KB |
0 |
0 |
0 Byte |
0 |
0 |
0 Byte |
|
3 |
2 |
0 |
1 |
35.73143 |
NA |
NA |
1 |
0.17307 |
0 |
0 |
0 Byte |
1 |
0.17307 |
256.00 KB |
0 |
0 |
0 Byte |
0 |
0 |
0 Byte |
|
4 |
2 |
0 |
NA |
NA |
1 |
1.38896 |
1 |
1.45957 |
0 |
0 |
0 Byte |
1 |
1.45957 |
256.00 KB |
0 |
0 |
0 Byte |
0 |
0 |
0 Byte |
|
Total |
10 |
0 |
3 |
140.33313 |
3 |
8.91023 |
6 |
3.62166 |
0 |
0 |
0 Byte |
6 |
3.62166 |
1.50 MB |
0 |
0 |
0 Byte |
0 |
0 |
0 Byte |
Kernel Summary Page
The Kernel summary page shows statistics for all the kernels that are dispatched by the application.
|
Kernel Name |
Device Name |
# of Calls |
Total Time(ms) |
Avg Time(ms) |
Max Time(ms) |
Min Time(ms) |
|
multiDeviceKernel |
CPU_Device |
3 |
140.33313 |
46.77771 |
69.07170 |
35.53000 |
|
multiDeviceKernel |
Juniper |
3 |
8.91023 |
2.97008 |
4.10271 |
1.38896 |
OpenCL™Top 10 Data Transfer Summary Page
The Top 10 Data transfer
summary page shows a sorted list of the ten most time-consuming OpenCL™ data
transfers operations. Clicking on a hyperlink takes you to the corresponding
item in the Timeline view.
Since data transfer operations can have a great impact on application
performance, ensuring that kernel execution operations and data transfer
operations overlap can lead to better overall performance.
|
Command Type |
Context ID |
Command Queue ID |
Duration(ms) |
Transfer Size |
Transfer Rate(MB/s) |
Thread ID |
Sequence ID |
|
WRITE_BUFFER |
4 |
5 |
1.45957 |
256.00 KB |
171.284 |
3496 |
108 |
|
WRITE_BUFFER |
0 |
1 |
0.94618 |
256.00 KB |
264.220 |
3496 |
16 |
|
WRITE_BUFFER |
2 |
3 |
0.68449 |
256.00 KB |
365.237 |
3496 |
56 |
|
WRITE_BUFFER |
1 |
2 |
0.21951 |
256.00 KB |
1138.895 |
3496 |
55 |
|
WRITE_BUFFER |
3 |
4 |
0.17307 |
256.00 KB |
1444.527 |
3496 |
107 |
|
WRITE_BUFFER |
0 |
0 |
0.13885 |
256.00 KB |
1800.569 |
3496 |
15 |
Top 10 Kernel Summary Page
The Top 10 kernel summary page shows a sorted list of the 10 most time-consuming kernel execution operations. Clicking on a hyperlink takes you to the corresponding item in Timeline view.
|
Kernel Name |
Context ID |
Command Queue ID |
Device Name |
Duration(ms) |
Global Work Size |
Work-Group Size |
Thread ID |
Sequence ID |
|
multiDeviceKernel |
0 |
0 |
CPU_Device |
69.07170 |
{65536} |
{64} |
3496 |
21 |
|
multiDeviceKernel |
3 |
4 |
CPU_Device |
35.73143 |
{65536} |
{64} |
1968 |
0 |
|
multiDeviceKernel |
1 |
2 |
CPU_Device |
35.53000 |
{65536} |
{64} |
3496 |
61 |
|
multiDeviceKernel |
0 |
1 |
Juniper |
4.10271 |
{65536} |
{64} |
3496 |
23 |
|
multiDeviceKernel |
2 |
3 |
Juniper |
3.41856 |
{65536} |
{64} |
3496 |
63 |
|
multiDeviceKernel |
4 |
5 |
Juniper |
1.38896 |
{65536} |
{64} |
2892 |
0 |
Warning(s)/Error(s) Page
The Warning(s)/Error(s) Page shows potential problems in your OpenCL™ or HSA application. It can detect unreleased resources, API failures, and it can provide suggestions for better performance. Clicking on a hyperlink takes you to the corresponding API.
|
Index |
Call Index |
Thread ID |
Type |
Message |
|
0 |
542 |
2268 |
Warning |
Memory leak detected [Ref = 1, Handle = 0x0B1730B0]: Object created by clEnqueueNDRangeKernel |
|
216 |
208 |
2268 |
Best Practices |
clEnqueueNDRangeKernel: Work-group size is too small - [1,1,1]. Recommended work-group size is a multiple of 64. |
|
270 |
319 |
2268 |
Best Practices |
clEnqueueNDRangeKernel: Global work size is too small - [111], resulting in low GPU utilization. |
|
144 |
482 |
1932 |
Error |
clEnqueueNDRangeKernel returns CL_INVALID_KERNEL_ARGS. |
From these summary pages, it is possible to determine whether an OpenCL™ application is bound by kernel execution or data transfer (Context Summary page). If the application is bound by kernel execution, you can determine which device is the bottleneck. From the Kernel Summary page, you can find the name of the kernel with the highest total execution time. From the Top 10 Kernel Summary page, you can find the individual kernel instance with the highest execution time. If the kernel execution on a GPU device is the bottleneck, the GPU performance counters can then be used to investigate the bottleneck inside the kernel.
If the application is bound by the data transfers, it is possible to determine the most expensive data transfer type (read, write, copy or map) in the application from the Context Summary page. You can then investigate whether you can minimize this type of data transfer by modifying the algorithm if necessary. With help from the Timeline View, you can investigate whether data transfers have been executed in the most efficient way (concurrently with a kernel execution).