

Run an Application Trace GPU Profile session
- Open or create a CodeXL project.
- Select the Application Timeline Trace profile mode
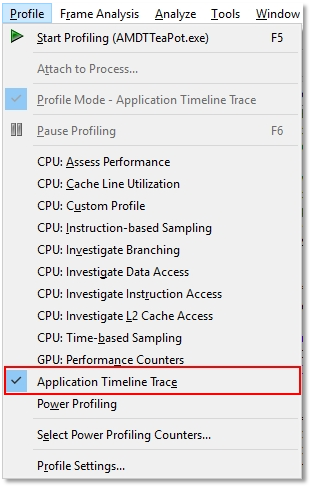
- Click the
 (Start Profiling)
toolbar button to start profiling.
(Start Profiling)
toolbar button to start profiling. - Stop the profiled application.
When the profiled application’s execution is over, CodeXL displays the session.
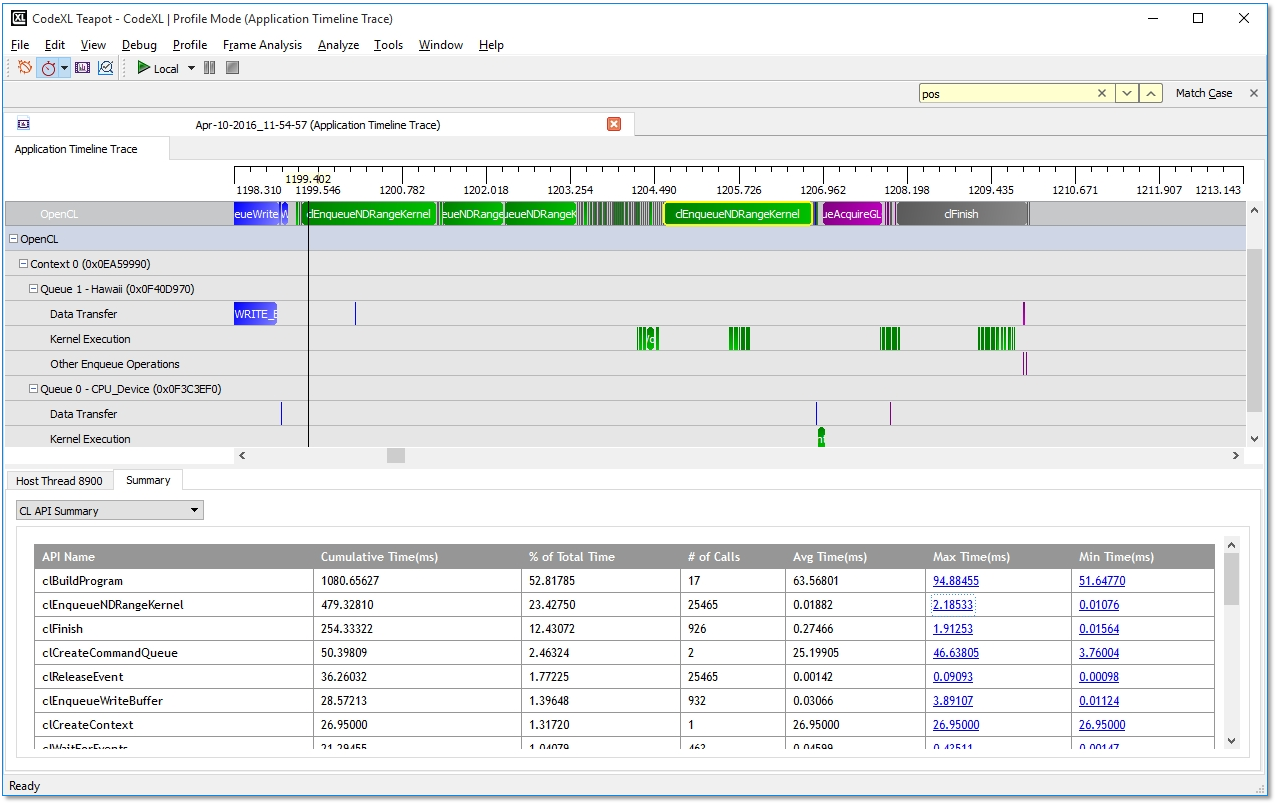
Timeline View
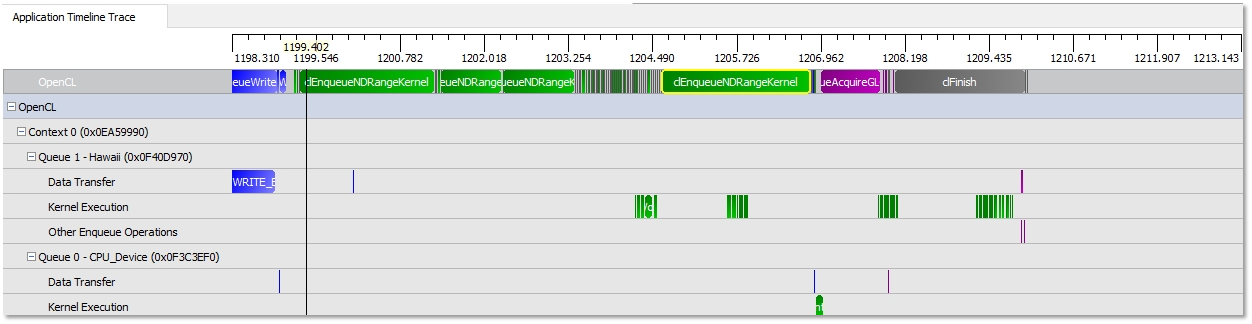
The Timeline View provides a visual representation of the execution of the application. Along the top of the timeline is the time grid, showing the total elapsed time (in milliseconds) of the application when fully zoomed out. Timing begins when the first OpenCL call is made by the application; it ends when the final OpenCL call is made. Directly below the time grid, each host (OS) thread that made at least one OpenCL call is listed. For each host thread, the OpenCL API calls are plotted along the time grid, showing the start time and duration of each call. Below the host threads, the OpenCL tree shows all contexts and queues created by the application, along with data transfer operations and kernel execution operations for each queue. We can navigate in the Timeline View by zooming, panning, collapsing/expanding or selecting a region of interest. From the Timeline View, we can also navigate to the corresponding API call in the API Trace View and vice versa. The Timeline View can be useful for debugging your OpenCL application. Some examples are:
· You easily can confirm that the high-level structure of your application is correct. By examining the timeline, you can verify that the number of queues and contexts created match your expectations for the application.
· You also can confirm that synchronization has been performed properly in the application. For example, if kernel A execution is dependent on a buffer operation and outputs from kernel B execution, then kernel A execution appears after the completion of the buffer execution and kernel B execution in the time grid. It can be hard to find this type of synchronization error using traditional debugging techniques.
· You also can confirm that the application has been using the hardware efficiently: the timeline should show that non-dependent kernel executions and data transfer operations occur simultaneously.
Summary Pages View
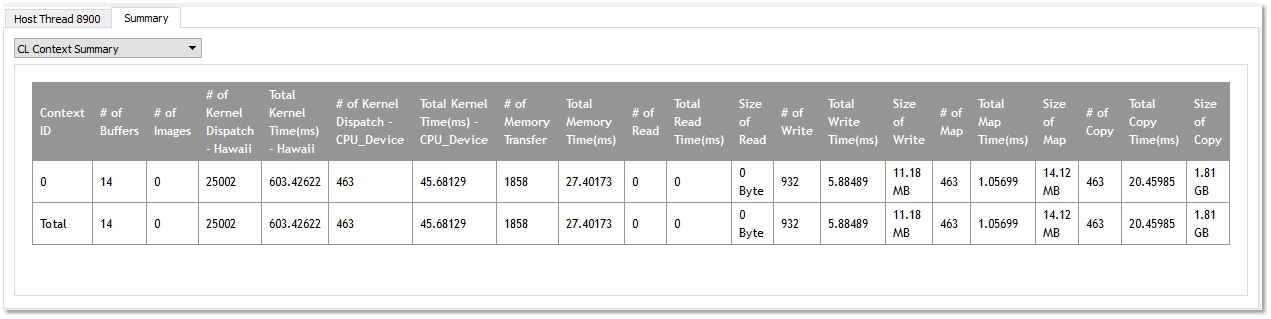
The Summary Pages View shows various statistics for your OpenCL application. It can provide you with a general idea of the location of the application's bottlenecks. It also provides useful information, such as the number of buffers and images created on each context, the most expensive kernel call, etc. The Summary Pages View provides access to the following individual pages:
· API Summary page ― Shows statistics for all OpenCL API calls made in the application for API hotspot identification.
· Context Summary page ― Shows the statistics for all the kernel dispatch and data transfer operations for each context. It also shows the number of buffers and images created for each context.
· Kernel Summary page ― Shows statistics for all the kernels that are created in the application.
· Top 10 Data Transfer Summary page ― Shows a sorted list of the ten most time-consuming individual data transfer operations.
· Top 10 Kernel Summary page ― Shows a sorted list of the ten most time-consuming individual kernel execution operations. From these summary pages, it is possible to determine whether the application is bound by kernel execution or data transfer (Context Summary page). If the application is bound by kernel execution, you can determine which device is the bottleneck. From the Kernel Summary page, we can find the name of the kernel with the highest total execution time. Or, from the Top 10 Kernel Summary page, we can find the individual kernel instance with the highest execution time. If the kernel execution on a GPU device is the bottleneck, the GPU performance counters then can be used to investigate the bottleneck inside the kernel. See Collecting OpenCL GPU Kernel Performance Counters for more details. If the application is bound by the data transfers, it is possible to determine the most time-consuming data transfer type (read, write, copy or map) in the application from the Context Summary page. You can investigate whether it is possible to minimize this type of data transfer by modifying the algorithm. With help from the Timeline View, you can investigate whether data transfers have been executed in the most efficient way (that is: concurrently with a kernel execution).
API Trace View
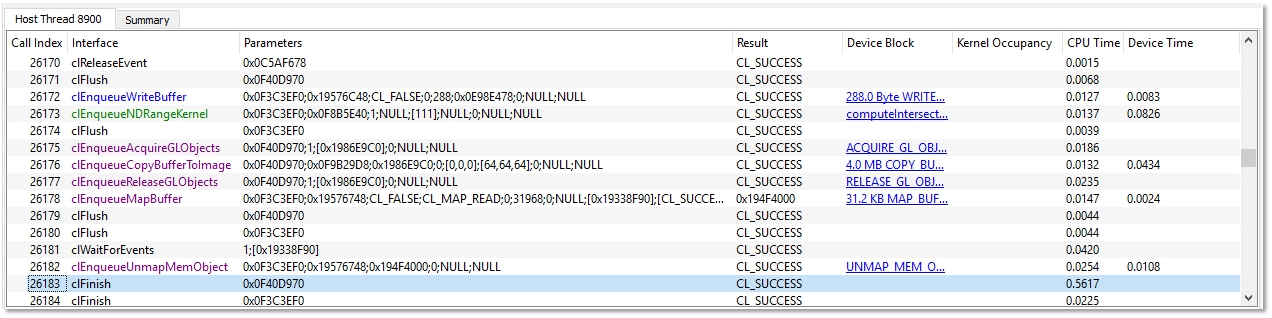
The API Trace View lists all the OpenCL API calls made by the application. Each host thread that makes at least one OpenCL call is listed in a separate tab. Each tab contains a list of all the API calls made by that particular thread. For each call, the list displays the index of the call (representing execution order), the name of the API function, a semi-colon delimited list of parameters passed to the function and the value returned by the function. When displaying parameters, the Profiler tries to dereference pointers and decode enumeration values to give as much information as possible about the data being passed in or returned from the function. Double-clicking an item in the API Trace View displays and zooms into that API call in the Host Thread row in the Timeline View.
This view lets you analyze and debug the input parameters and output results for each API call. For example, you easily can check that all the API calls return CL_SUCCESS, or that all the buffers are created with the correct flags. This view also lets you identify redundant API calls.