The CPU Profile view is used to control the profile data collection options. The selected settings persist and apply to future profile data collection sessions that are started within a project; they persist until the profile settings are modified.
1. Click the Profile > Profile Settings menu item.
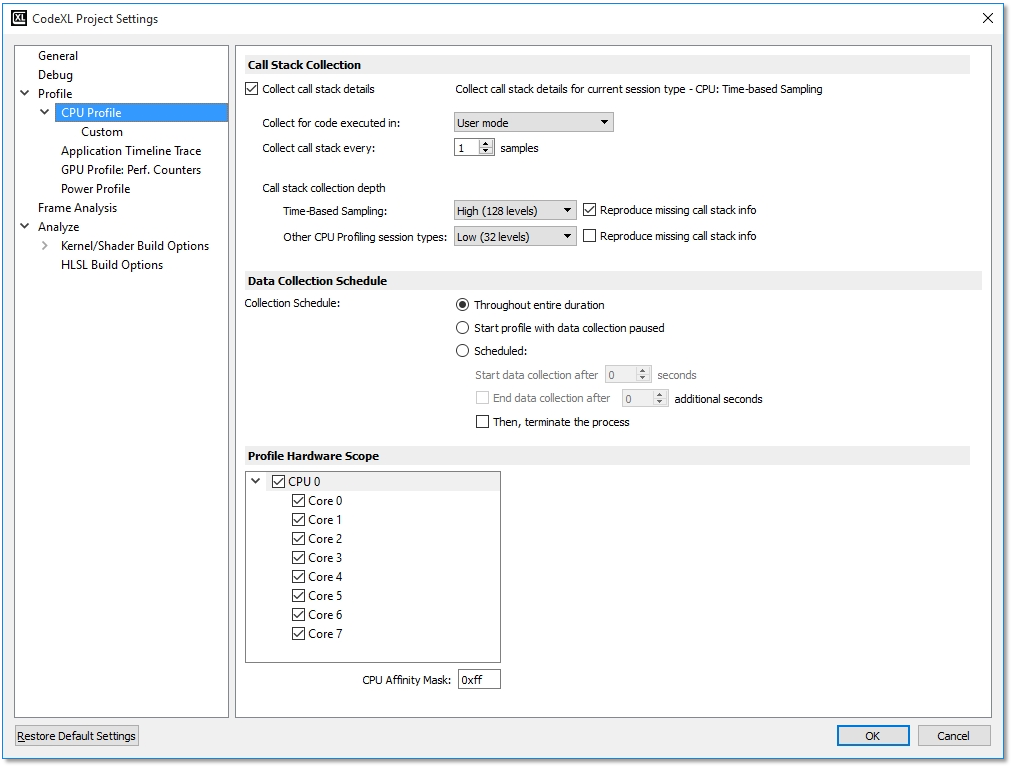
2. Click the Profile tree node in the left pane. The CPU Profile settings page is displayed (see the following screenshot).
3. Select Collect call stack details to enable the collection of call stack data to analyze caller-called relationships and call frequency.
Note: The collection of call stack is not supported for Java or CLR based applications. For those applications, this checkbox would be unchecked and disabled.
· Set the value for Collect for code executed in drop box, to apply call stacks collection only to code sampled in User space, Kernel space or both (User space and Kernel space).
· Set the value for Collect Call Stack every spin box, to specify how often a CSS sample is taken. If the selected value is N for example, then a CSS sample is taken every N regular samples. By default it is set to 1.
· Set the value for Call Stack Collection Depth. Use Maximal for high accuracy, and Minimal for lower performance overhead.
Note: This option is set separately for Time-Based Sampling and other CPU Profiling session types.
· Check the Reproduce missing call stack info check box, to perform additional analysis to overcome frame-pointer omission (FPO) in 32-bit apps and lack of unwind info in 64-bit. The profiler will store additional data during the profile session and require more time during post-session processing.
Note: This option is set separately for Time-Based Sampling and other CPU Profiling session types.
4. In the Data Collection Schedule section:
· Select Throughout entire duration if you want the data to be collected throughout the entire execution of the profile session.
· Select Start profile with data collection paused if you want to start the application and then decide when data collection should be started.
· Select Scheduled: if you want to set the data collection start after and end after values. Once this option is checked, set the values for the start / end timing of the data collection.
5.
Select / Unselect cores in the cores
tree under Profile Hardware Scope, when you want to limit the execution
of the program to the selected cores in a multicore system.