

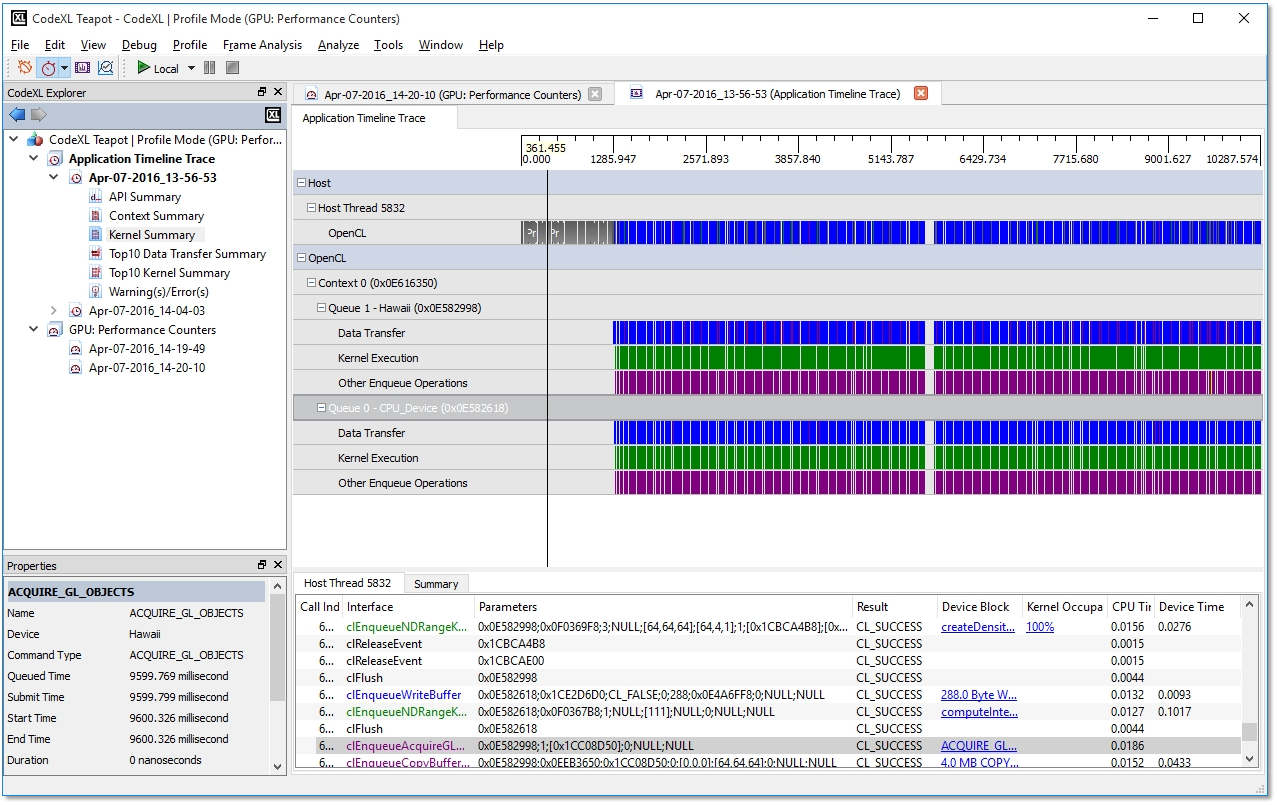
The following screenshot shows the timeline and API trace data for a profile session. To get the .atp file of the result, right-click the session in the CodeXL Explorer , and select "Open Containing Folder" from the menu. See Description of Output Files for a detailed description of the format of this file.
From the application trace data, you can:
· Discover the high-level structure of the application with the Timeline View. For OpenCL™ programs, you can use this view to determine the number of OpenCL™ contexts and command queues created, as well as the relationships between these items in the application.
· Determine if an OpenCL™ application is bound by kernel execution or data transfer operations.
· View and debug the input parameters and output results for all API calls made by the application with the API Trace View.
· View and analyze the performance for sections in the program, using AMDTActivityLogger.
The panel is divided into two sections. The upper section shows the application timeline, the lower section shows the API trace.
Application Timeline Trace
The application timeline provides a visual representation of the execution of the application. Along the top of the timeline is the time grid, which shows the total elapsed time, in milliseconds, of the application. Timing begins when the first OpenCL™ of HSA call is made by the application; it ends when the final OpenCL™ or HSA call is made.
Directly below the time grid, each host (OS) thread that made at least one OpenCL™ or HSA call is listed. For each host thread, the API calls are plotted along the time grid, showing the start time and duration of each call. Below the host threads, an API-specific tree shows device-specific information. For OpenCL™, the tree shows all contexts and queues created by the application, along with data transfer operations and kernel execution operations for each queue. For HSA, the tree shows all kernels dispatched to a particular device.
The Timeline View can be useful for debugging your OpenCL™ application. Using the data displayed in the timeline, you can:
· Easily confirm that the high-level structure of your application is correct. By examining the timeline, you can verify that the number of queues and contexts created matches your expectations for the application.
· Confirm that synchronization has been performed properly in the application. For example, if kernel A execution is dependent on a buffer operation and outputs from kernel B execution, then kernel A execution appears after the completion of the buffer execution and kernel B execution in the time grid. It can be hard to find this type of synchronization error using traditional debugging techniques.
· Confirm that the application has been using the hardware efficiently. For example, the timeline shows that non-dependent kernel executions and data transfer operations occur simultaneously.
Navigating the Application Timeline
The application timeline provides many ways to view and analyze the profile result: through zooming, navigating, and expanding/collapsing.
Zooming
When first opened, the timeline view is fully zoomed out: the entire application timeline is visible in the timeline. It can be useful to zoom in to specific parts of the timeline in order to better understand the profiling data. As you zoom in and out, the time grid at the top changes to display the timestamp of the currently displayed timeline subsection.
1.
Manual zoom ‒ Use the mouse wheel to manually zoom in and out. Roll the
mouse wheel up to zoom in, and down to zoom out. If using a mouse not equipped
with a mouse wheel, or if you prefer to use the keyboard, you can use the plus
key to zoom in, and the minus key to zoom out. The current zoom pivot point
(displayed as a vertical line over the entire timeline) represents the point in
the timeline into which the view is zoomed. The zoom pivot point tracks the
mouse cursor as it moves over the timeline. The current timestamp represented
by the zoom pivot is displayed as a hint in the grid displayed at the top of
the timeline.
2.
Zoom into specific API call ‒ To zoom into a particular API call, double-click the API
call in the API Trace list.
3. Zoom into specified region ‒ To zoom into a specific region of the timeline, hold down the Control key and drag the mouse to highlight a specific region. When you release the mouse button, the timeline is zoomed into the highlighted region. While you are dragging, hints are displayed in the grid at the top of the timeline, showing the start and end timestamps for the selected region, as well as the duration of the selected region.
Navigation
When the timeline is zoomed in, you can navigate to different parts of the timeline. You can use either the horizontal scrollbar (located along the bottom of the timeline), or you can click and drag the mouse to pan the timeline within the viewable area. You also can use the left or right arrow keys on the keyboard to pan the timeline within the viewable area.
Expanding and Collapsing the timeline tree
When the timeline is first displayed, its tree is fully expanded. You can collapse parts of the tree in order to limit the amount of data shown. Use the tree view controls within the timeline to collapse or expand parts of the timeline tree. When a branch of the tree is collapsed, timeline items from the collapsed sub-branches are displayed in the parent branch.
Viewing timeline item details
There are several ways to view more information about items shown in the timeline view.
1.
Tooltip hints ‒ Hover the mouse over a block shown in the timeline, and a
tooltip hint appears. It gives additional details about that block.
2. Navigating to the API trace ‒ Click an API block in a "Host Thread" row, and that block is selected in the API Trace. There, additional details for that particular API call are shown. Click an item in the "Data Transfer" or "Kernel Execution" row, and the enqueue API that enqueued the data transfer or kernel execution is selected in the API Trace.
API Trace
The API trace is a list of all the OpenCL™ or HSA API calls made by the application. Each host thread that makes at least one API call is listed in a separate tab. Each tab contains a list of all the API calls made by that particular thread. For each call, the list displays:
· the index of the call (representing execution order),
· the name of the API function,
· a semi-colon delimited list of parameters passed to the function, and
· the value returned by the function.
When displaying parameters, the Profiler tries to dereference pointers and decode enumeration values; this is in order to give as much information as possible about the data being passed in, or returned from, the function. Double-clicking an item in the API Trace list displays and zooms into that API call in the Host Thread row in the Application Timeline.
For OpenCL™ Enqueue API calls that result in either a kernel execution or a data transfer operation, there is a clickable entry in the "Device Block" column. Clicking this entry zooms into the corresponding timeline block under the OpenCL™ tree in the timeline.
For OpenCL™ Enqueue API calls that result in a kernel execution on a GPU, there is a clickable value in the "Kernel Occupancy" column. Clicking this entry opens the GPU Profiler Kernel Occupancy Viewer, which provides more information about the kernel occupancy.
If the option to Enable navigation to source code is checked on the Application Timeline Trace page, you can right-click any item in the API trace and choose Go to source code from the context menu. This uses the symbol information generated during the trace to navigate to the source code location of the API call. Note that this feature only works if the profiled application was built with debugging information.
The API Trace lets you analyze and debug the input parameters and output results for each API call. For example, you can easily check that all the API calls are returning CL_SUCCESS (OpenCL™) or HSA_STATUS_SUCCESS (HSA), or that all the OpenCL™ buffers are created with the correct flags. You also can identify redundant API calls using the API Trace.
Colors
Colors are used in both the application timeline and the API Trace to help distinguish data transfer and kernel dispatch. Green is used on kernel dispatch items for both the OpenCL™ Enqueue calls from the host and the kernels themselves on the device. Shades of blue are used to color OpenCL™ data transfer items, with slight color variations for read, write, and copy calls.
Note: Special case when the OpenCL™ trace may be incomplete
When the setting to write trace data in intervals during program execution is enabled on the Application Timeline Trace page (which is the default and only supported mode on Linux), the application trace might not include the full trace of all APIs called by the application. This is because any APIs called after the final interval in the application's lifetime might be omitted. To limit the number of APIs omitted in this scenario, the Profiler also writes all queued-up trace data when the clReleaseContext API is called. However, if an application does not call clReleaseContext to clean up any OpenCL™ contexts it has created, or if it calls any OpenCL™ APIs after the final clReleaseContext call, then the trace might not contain all APIs called.