 CodeXL User Guide
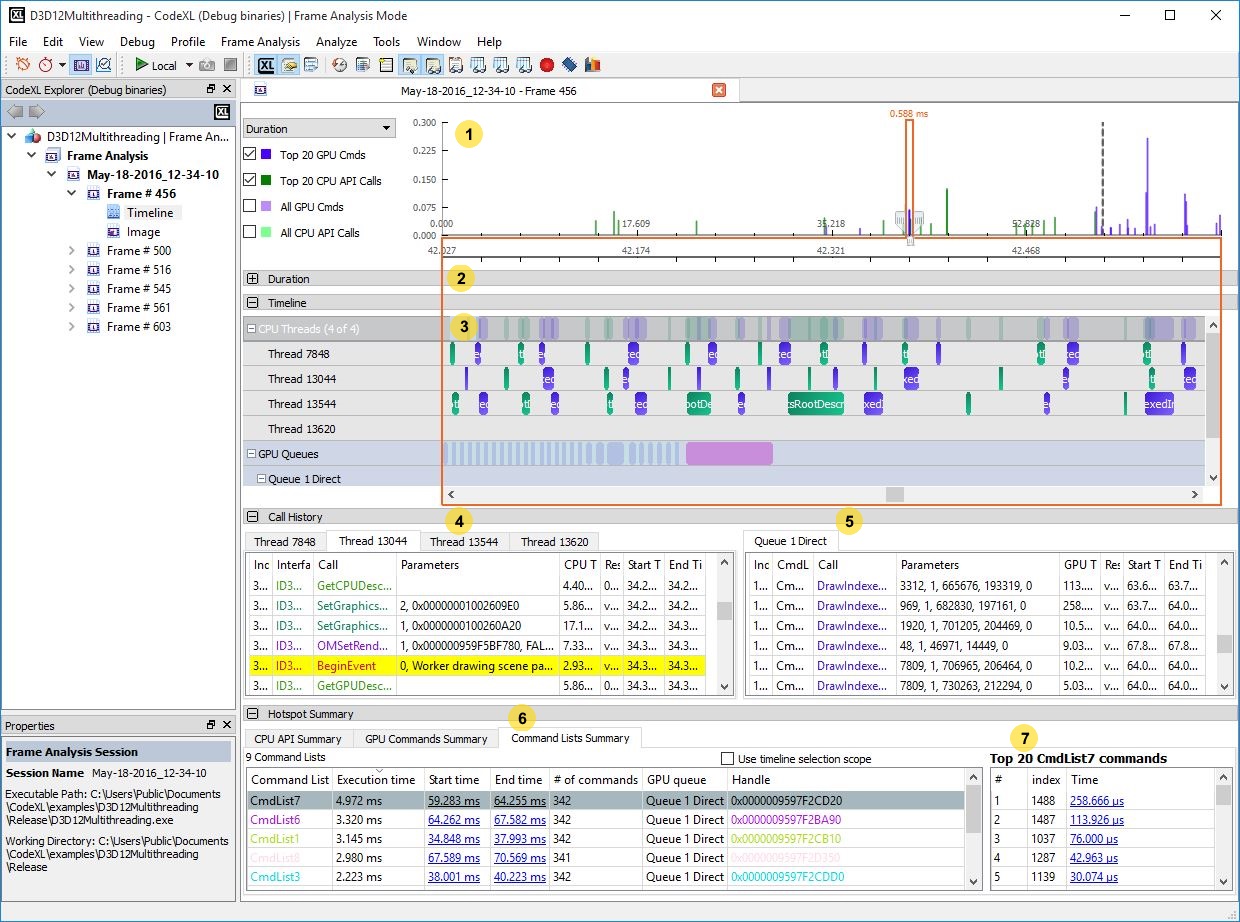
The frame timeline view contains the following elements (from bottom to top). Each of the elements’ numbers is in the screenshot above.
1. A navigation chart that allows you to zoom in and out, view the whole frame timeline or focus on a fragment of it, and display API calls duration, count and concurrency.
2. A collapsed detailed view of the API calls and their durations/count/concurrency.
3. A timeline chart visualizing the API calls over the frame timeline.
4. An API calls table for each of the CPU threads.
5. A commands table for each of the GPU command queues.
6. Summary tables that summarize the time consumption for each of the API types in the frame.
7. A Top 20 calls table for the currently selected API in the summary table.

