

This page lets you configure the behavior of the Profiler when it collects performance counters.
Settings
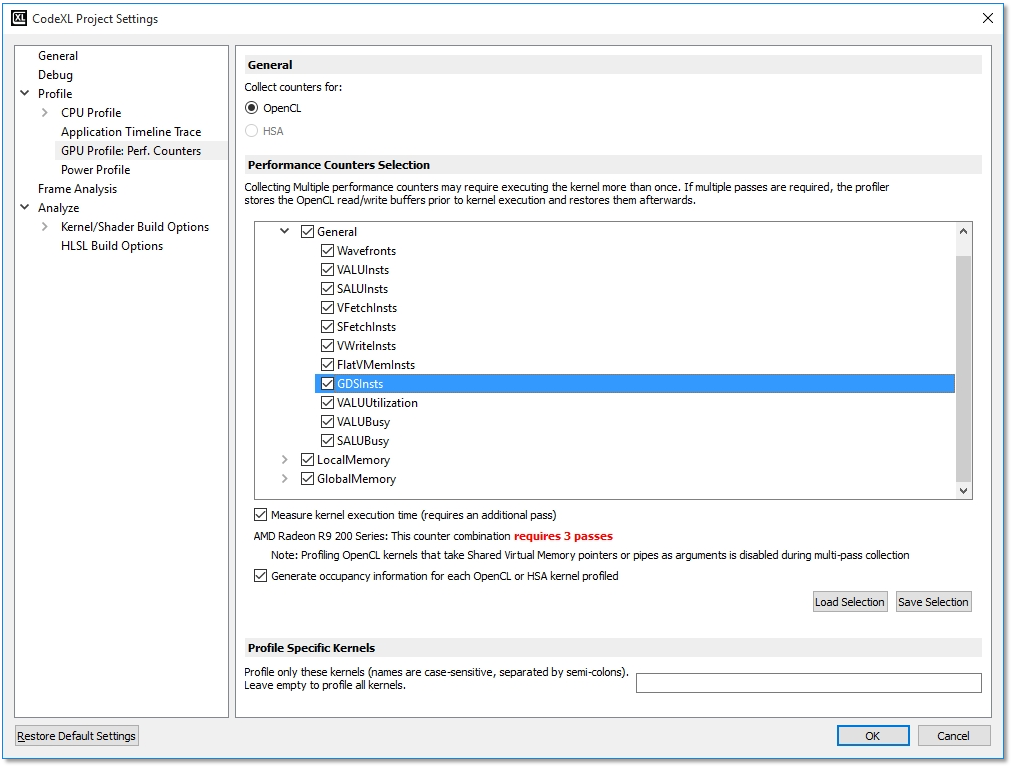
· Measure kernel execution time when checked, requires an additional pass during collection. (only applicable for OpenCL)
· Generate occupancy information for each OpenCL™ or HSA kernel profiled When checked, the Profiler generates kernel occupancy data for each OpenCL™ kernel dispatched to a GPU device.
· Profile specific kernels Profile only kernels that their names are specified.
· Counter selection TreeView This treeview displays the available GPU performance counters that can be enabled for a profile session. The performance counters are grouped by counter type. The counters shown depend on the type of GPU installed on the system. If the system has multiple GPU devices from multiple hardware families, the tree contains a top-level node for each available hardware family. For instance, if a system has both an AMD Radeon™ HD 7000 series GPU device (one based on Graphics Core Next Architecture) and an AMD Radeon™ HD 5000 series device, then the counter selection treeview includes counters supported by each device (see screenshot below).
· Some counter selection combinations require multi-pass collection. When profiling using multiple passes, any OpenCL kernels that use shared virtual memory or pipes as arguments will not be profiled.
· When more than one pass is required, the number of required passes will be displayed next to the device name.
· To load and save the counter selections to a file, click on the Load Selection and Save Selection buttons.
Below is a list and brief description of available counters. You also can use the cursor to hover over the counter names in the treeview to view the descriptions.
· The full set of counters for AMD Radeon™ HD 7000 series GPU devices or newer (based on Graphics Core Next Architecture) are described in the following table.
|
Name |
Description |
|
Wavefronts |
Total wavefronts. |
|
VALUInsts |
The average number of vector ALU instructions executed per work-item (affected by flow control). |
|
SALUInsts |
The average number of scalar ALU instructions executed per work-item (affected by flow control). |
|
VFetchInsts |
The average number of vector fetch instructions from the video memory executed per work-item (affected by flow control). |
|
SFetchInsts |
The average number of scalar fetch instructions from the video memory executed per work-item (affected by flow control). |
|
VWriteInsts |
The average number of vector write instructions to the video memory executed per work-item (affected by flow control). |
|
FlatVMemInsts |
The average number of FLAT instructions that read from or write to the video memory executed per work item (affected by flow control). Includes FLAT instructions that read from or write to scratch. |
|
GDSInsts |
The average number of GDS read or GDS write instructions executed per work item (affected by flow control). |
|
VALUUtilization |
The percentage of active vector ALU threads in a wave. A lower number can mean either more thread divergence in a wave or that the work-group size is not a multiple of 64. Value range: 0% (bad), 100% (ideal - no thread divergence). |
|
VALUBusy |
The percentage of GPUTime vector ALU instructions are processed. Value range: 0% (bad) to 100% (optimal). |
|
SALUBusy |
The percentage of GPUTime scalar ALU instructions are processed. Value range: 0% (bad) to 100% (optimal). |
|
LDSInsts |
The average number of LDS read or LDS write instructions executed per work-item (affected by flow control). |
|
FlatLDSInsts |
The average number of FLAT instructions that read or write to LDS executed per work item (affected by flow control). |
|
LDSBankConflict |
The percentage of GPUTime LDS is stalled by bank conflicts. Value range: 0% (optimal) to 100% (bad). |
|
FetchSize |
The total kilobytes fetched from the video memory. This is measured with all extra fetches and any cache or memory effects taken into account. |
|
WriteSize |
The total kilobytes written to the video memory. This is measured with all extra fetches and any cache or memory effects taken into account. |
|
CacheHit |
The percentage of fetch, write, atomic, and other instructions that hit the data cache. Value range: 0% (no hit) to 100% (optimal). |
|
MemUnitBusy |
The percentage of GPUTime the memory unit is active. The result includes the stall time (MemUnitStalled). This is measured with all extra fetches and writes and any cache or memory effects taken into account. Value range: 0% to 100% (fetch-bound). |
|
MemUnitStalled |
The percentage of GPUTime the memory unit is stalled. Try reducing the number or size of fetches and writes if possible. Value range: 0% (optimal) to 100% (bad). |
|
WriteUnitStalled |
The percentage of GPUTime the Write unit is stalled. Value range: 0% to 100% (bad). |