Once a CodeXL project is started, the initial interface is displayed, as shown in the following screenshot.
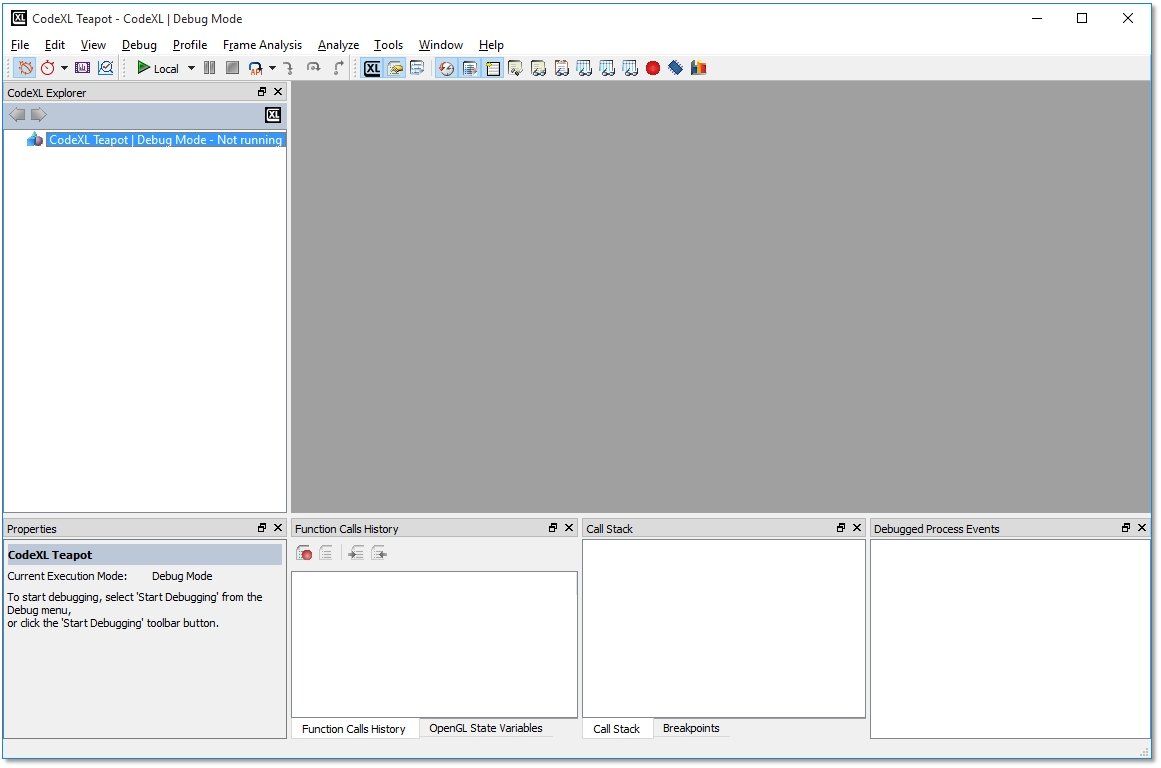
CodeXL Initial Layout when a project is loaded
The CodeXL toolbar allows quick access to CodeXL views and main controls.

|
Debug Mode |
|
Switch CodeXL to Debug mode. This is the default mode. |
|
Profile Mode |
|
Switch CodeXL to Profile mode. Use the Profile menu to switch between the various profile modes. |
|
Frame Analysis Mode |
|
Switch CodeXL to Frame Analysis mode. |
|
Analyze Mode |
|
Switch CodeXL to Analyze mode. |
|
Start Debugging / Profiling |
|
Start the startup project with CodeXL in the selected mode. |
|
Pause / Stop Debugging / Profiling |
|
Pause / Stop the startup project with CodeXL in the selected mode. |
|
Debug Steps |
|
API step / Draw Step / Frame Step / Step In / Step Over / Step Out the debugged application. |
|
CodeXL Explorer |
|
Show the CodeXL Explorer tree view. |
|
Properties View |
|
Show the Properties view. |
|
Output View |
|
Show the Output view |
|
Function Calls History View |
|
Show the Function Calls History view. |
|
Debugged Process Events View |
|
Show the Debugged Process Events view. |
|
Call Stack View |
|
Show the Debugger Call Stack view. |
|
Locals View |
|
Show the Debugger Locals view. |
|
Debugger Watch View |
|
Show the Debugger Watch view. |
|
Debugger OpenGL State Variables View |
|
Show the Debugger OpenGL State Variables view. |
|
OpenCL Debugger Multiwatch View 1, 2, 3 |
|
Show the OpenCL Debugger Multiwatch views. |
|
Debugger Breakpoints View |
|
Show the Debugger Breakpoints view. |
|
Debugger Memory View |
|
Show the Debugger Memory view. |
|
Debugger Statistics View |
|
Show the Debugger Statistics view. |