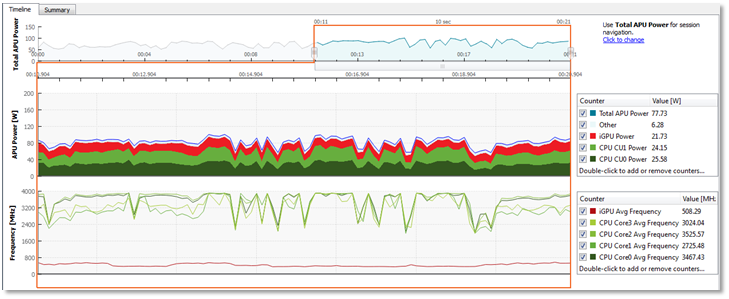
The Power Profiler Timeline View displays the measured values of the activated counters throughout the session. The horizontal axis of all charts represents the time that has passed since the beginning of the session. During profiling sessions, all of the charts in the Timeline View are being updated in real-time with the measured values which are streaming in. The uppermost ribbon (titled “Total APU Power”) displays the overall power consumption of the APU throughout the session.
The top chart has an adjustable range slider that controls the display of all the other timeline charts. By performing such actions as dragging the slider sideways, extending or retracting it, you set the scope of attention and the focus of the timeline charts. Each of the charts below displays only the data that was collected in the time range corresponding to the slider’s position and length. That is, the data in all timeline charts, except for the Total APU Power chart itself, is dictated by the time range which is selected by the Total APU Power chart’s range slider.
Below the Total APU Power ribbon, you will find additional ribbons containing more graphs, according to the set of activated counters: A Power chart which displays the power consumed by specific APU components (such as CPU cores or integrated GPU), a Frequency chart which displays the frequency of the selected components, a Temperature chart which displays the thermal trend of the selected components, and a CPU State chart which displays the CPU core states. The APU Power graph is always displayed, since the Total APU Power counter is activated by default and cannot be deactivated. The other charts (frequency, temperature and CPU core state) are optional, and will only be displayed if the relevant counters were activated.
To the right side of each chart you will find a legend that displays the measured values at a specific point in time. To change the point in time for which the values are displayed, reposition the mouse cursor horizontally on one of the graphs. The list of counters in the legends is customizable, and specific counters can be removed/added between profile sessions.