Navigating and displaying power profiling sessions is performed using the CodeXL Explorer tree, same as for other types of CodeXL profiling sessions. Each power profiling session is represented by a node in the tree, containing two sub-nodes for the Timeline and Summary views. Double clicking a node opens its respective view in the MDI space.
A session can be imported into the CodeXL project by right-clicking on the Power Profiling node and selecting ‘Import Session’. The dialog that opens allows you to navigate to the location of the session to import, and displays a filtered list of files that correspond to the *.clxdb naming format.
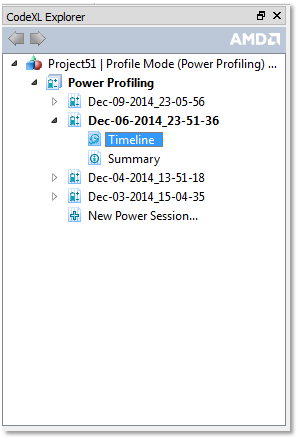
By clicking the “New Power Session…” node a new session is created, but sampling of data does not yet begin. The Timeline and Summary view tab will appear, and you can select which counters will be collected during the profile session by either
· Double-clicking the last line in the timeline charts legend table “Double-click to add or remove counters…”
· Selecting the “Select Power Profiling Counters…” command from the menu. This command is located in the standalone CodeXL app’s Profile menu, and in the Visual Studio CodeXL menu.
To begin the sampling of data in the new session, click the “Start Profiling” toolbar button, or select “Start Profiling” from the Profile menu (standalone CodeXL) or CodeXL menu in Visual Studio.
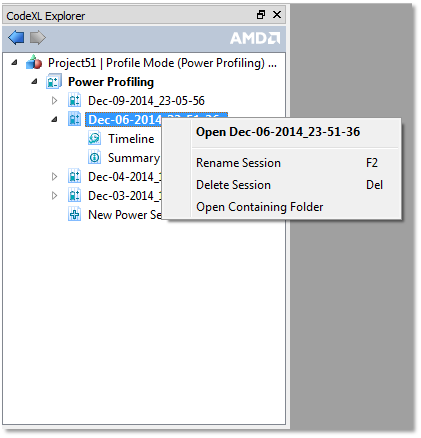
Right-click on a session node in the explorer tree will display the session context menu which is identical to the context menu for other profile session types.