

CodeXL allows API-level debugging of any OpenCL and / or OpenGL based application, regardless of implementation version and underlying hardware.
CodeXL API-level debugging is how CodeXL displays the CPU (client) side of your OpenCL or OpenGL application. This means CodeXL can suspend the debugged application at any OpenCL and OpenGL API function, display the call stack for these function calls, display API calls history and give many analysis options for debugging this part of the application.
To run the debugged application, press the Go button (F5).
Once the application is running, you can suspend it by adding an API breakpoint or by pressing the "break" button.
Once the application is suspended, you can use the API steps drop-down to choose between API Step (Ctrl + F10 - run to the next API function call), Draw Step (Ctrl + Shift + F10 - run to the next OpenGL draw call) and Frame Step (Ctrl + F11 - run to the next frame terminator API function call).
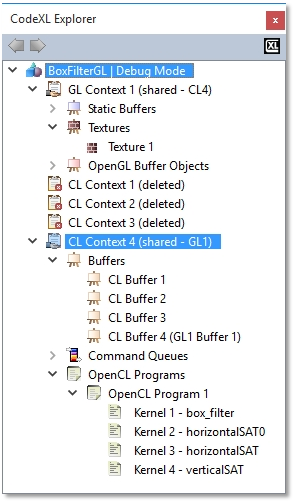
The CodeXL Explorer tree view is an invaluable view in CodeXL. When the debugged application is suspended (by a breakpoint, a step command, a break command, etc.), this view fills with the hierarchy of all OpenCL and OpenGL objects allocated by the debugged application. Each context or category can be expanded to show its contained objects, and the CodeXL Properties view updates with the details of the selected object. Double-clicking any of the objects usually shows the contents of the object in some form.
View Compute and Graphic Memory Consumption
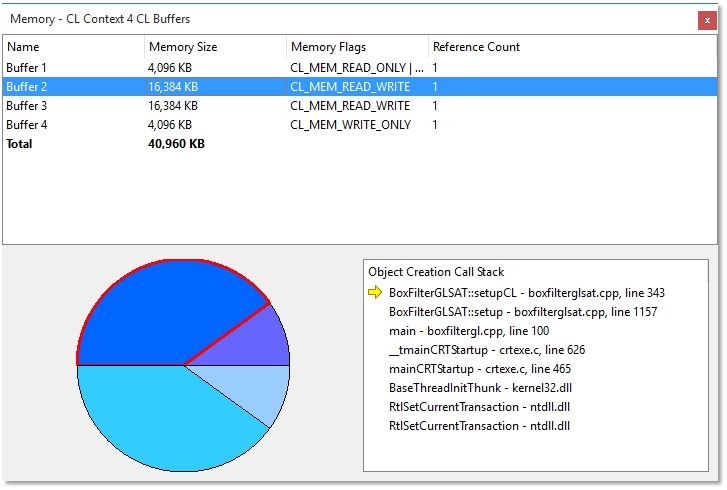
All of the compute and graphic memory information collected by CodeXL is displayed in the Memory view. To open this view, right-click on the object in the object tree, and select the "Memory analysis" option of the object. This view lists all the allocated objects of a given type (for example, context 1's buffers), as well as information regarding their memory consumption depending on the kind of objects listed. The graph view shows a breakdown of all the graphic memory consumed by the items in the current category. To see the scenario that led to an object's creation, use the Creation Calls Stack view. If the debugged application has debug information, double-clicking on a line in the Creation Calls Stack view opens the location in the source file.
Find Unrecommended Function Calls
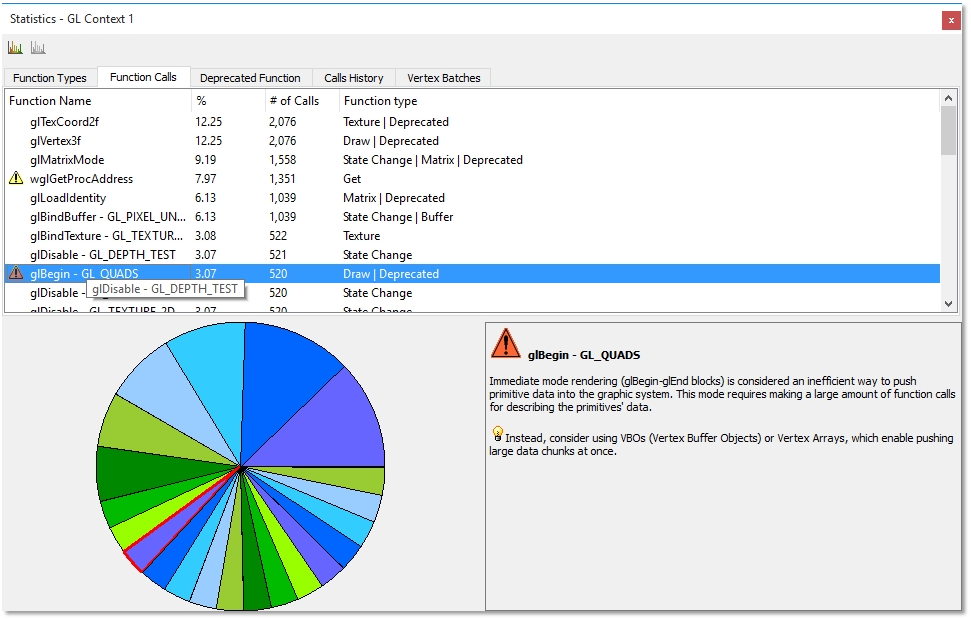
Open the Statistics view. In the "Function Calls Statistics" tab, you might see warning icons next to some of the function names. Click any of these functions to display an explanation of why is it unrecommended, and what alternative is available.
View Buffers, Images, and Textures Information and Data
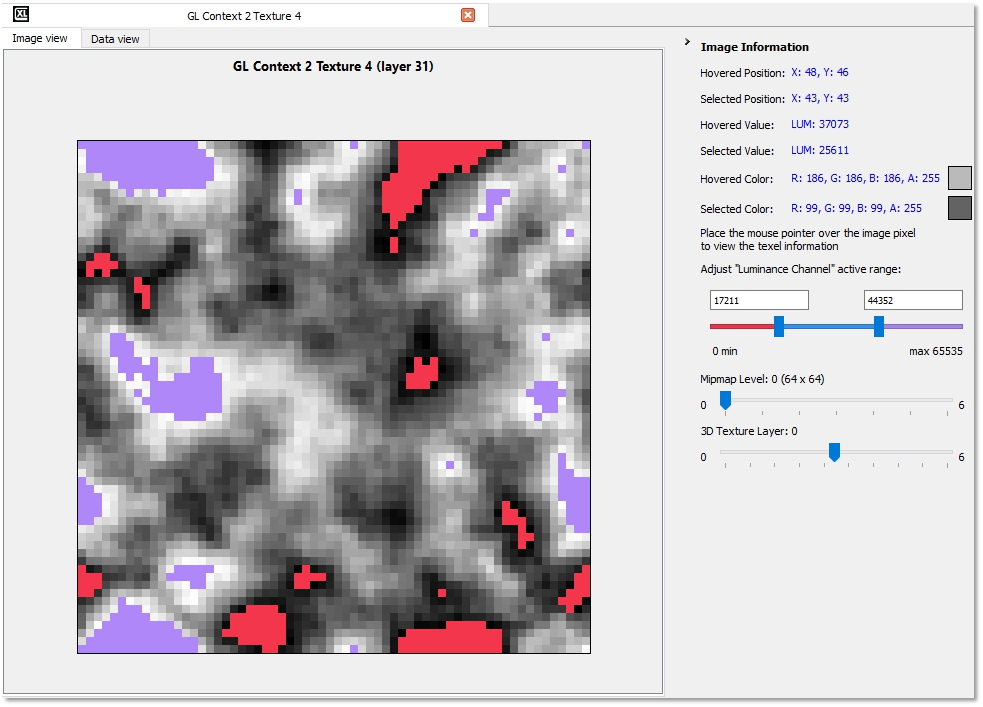
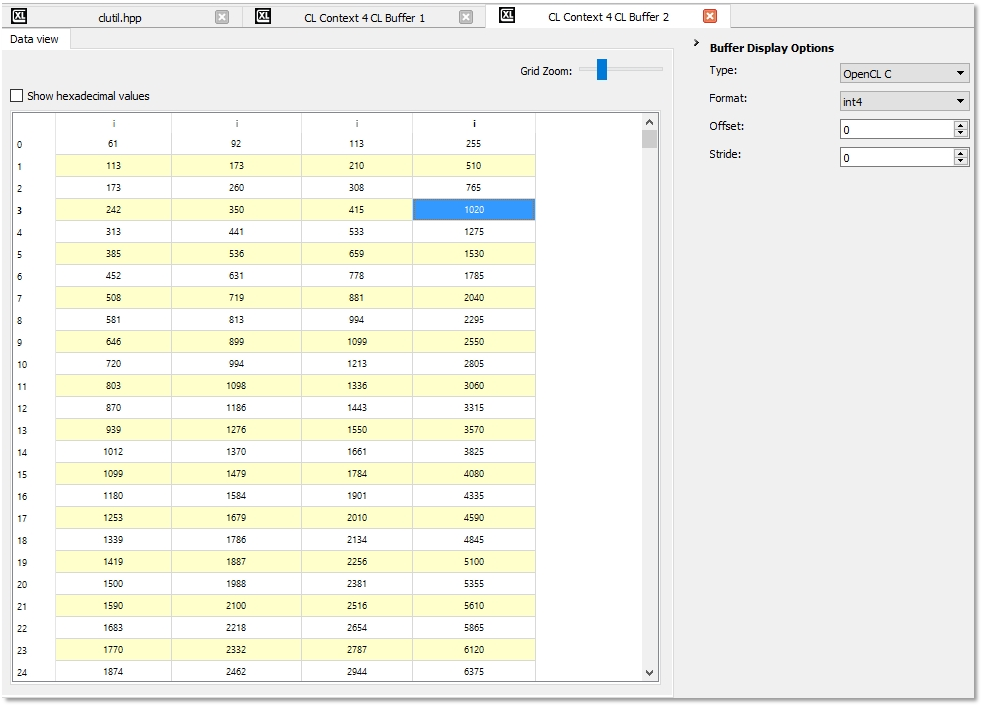
Double-clicking the main branch for buffers, images, or textures in the CodeXL Explorer (such as "CL Context 1 Images" or "GL Context 3 VBOs") opens a thumbnail view for those objects, to give a quick overview. Clicking an object in this view or double-clicking it in the CodeXL Explorer opens an Object view for it in the main views area. This view has a Data view spreadsheet showing the raw object data where each cell in the spreadsheet shows the value of each pixel, and an Image view that visualizes the object. Clicking on a pixel samples it and keep its information in the "Selected Pixel" entry in the Information Panel on the right section of the view. Using the Images and Buffers toolbar, you can disable some or all the channels and zoom in and out on the image. You also can invert the image's colors, convert it to grayscale and rotate it. The Image Information panel on the right gives you controls over multi-imaged or multi-layered objects, such as 3D images, array textures, or mipmapped textures. Use the various sliders to change between the object elements.
OpenCL buffers and OpenGL VBOs do not have the context of pixels, coordinates, and channels; thus, they are not visualized by the image view. Since they contain raw byte data, they even have no type or format information built-in into them. Instead, the Information panel has a combo-box letting you choose from the available data types and formats for use in their respective APIs.
View OpenCL Program and OpenGL Shader Source Code
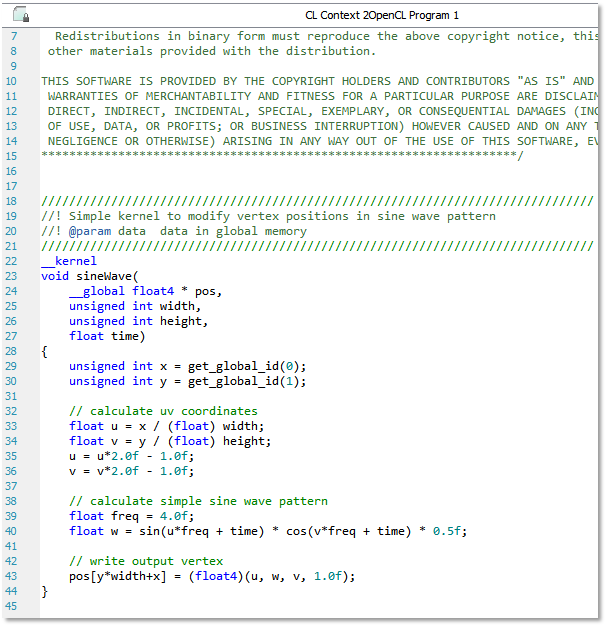
To view an OpenCL program or OpenGL shader's source code, double-click it in the CodeXL Explorer. If you are using *.cl files for OpenCL program source, adding the directory as the kernel source files folder in the Debug Settings dialog lets CodeXL to identify the source. This means you can set breakpoints inside the program before it was created and built at runtime, and you can persist breakpoints between debug sessions. Source viewing, of course, only applies to objects compiled at run time, and does not work with objects created with binaries. Double-clicking a kernel highlights the kernel function inside the program source. Applications that load program or shader source from strings or generate it at run time, have the sources saved to temporary files. Use the "File > Save As..." option to keep these files for comparison or analysis.
View OpenGL Program Pipeline and Sampler Objects
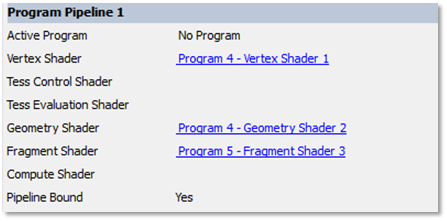
To view an OpenGL Program Pipeline or Sampler object, click on the object’s node in the CodeXL Explorer. This will display the object’s current state in the CodeXL Properties view. The state of Program Pipelines may contain references to OpenGL Shaders. These references will be displayed in the CodeXL Properties view as links. To view an OpenGL Shader’s source code, just click on the link. Here is a snapshot of the CodeXL Properties view after clicking on a Program Pipeline object.
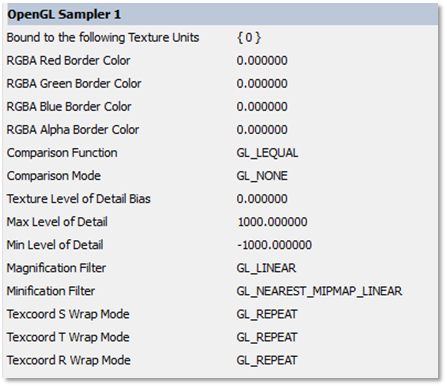
Here is a snapshot of the CodeXL Properties view displaying the state of an OpenGL Sampler object. Note that the “Bound to the following Texture Units” field may contain more than one texture (in a comma separated list between the curly brackets).
Work with API Function Breakpoints
Any CodeXL-supported OpenCL or OpenGL function can be set as a breakpoint in the Breakpoints dialog (Alt+Shift+B). The API Functions list contains all the supported functions. The Active Breakpoints list contains all the currently selected breakpoints. Each selected breakpoint has a checkbox next to it, representing whether the breakpoint is currently enabled. Disabling breakpoints instead of removing them saves the time of finding the function each time you want to enable the breakpoint. To add a function to the breakpoints list, select it in the API functions list and press Add or double-click it. To remove a breakpoint, select it in the breakpoints list and press Remove or double click it. Using breakpoints can help you see the exact API status before the function is called, also allowing a comparison of the status before and after the function call (by pressing the Step Over button (F10) after the breakpoint hit). You also can use breakpoints to find where in your code each function is called, by looking at the Call Stack view after the breakpoint is hit. if you have debug information for the stack item, you can double-click it to see the exact location in the MDI source view.