

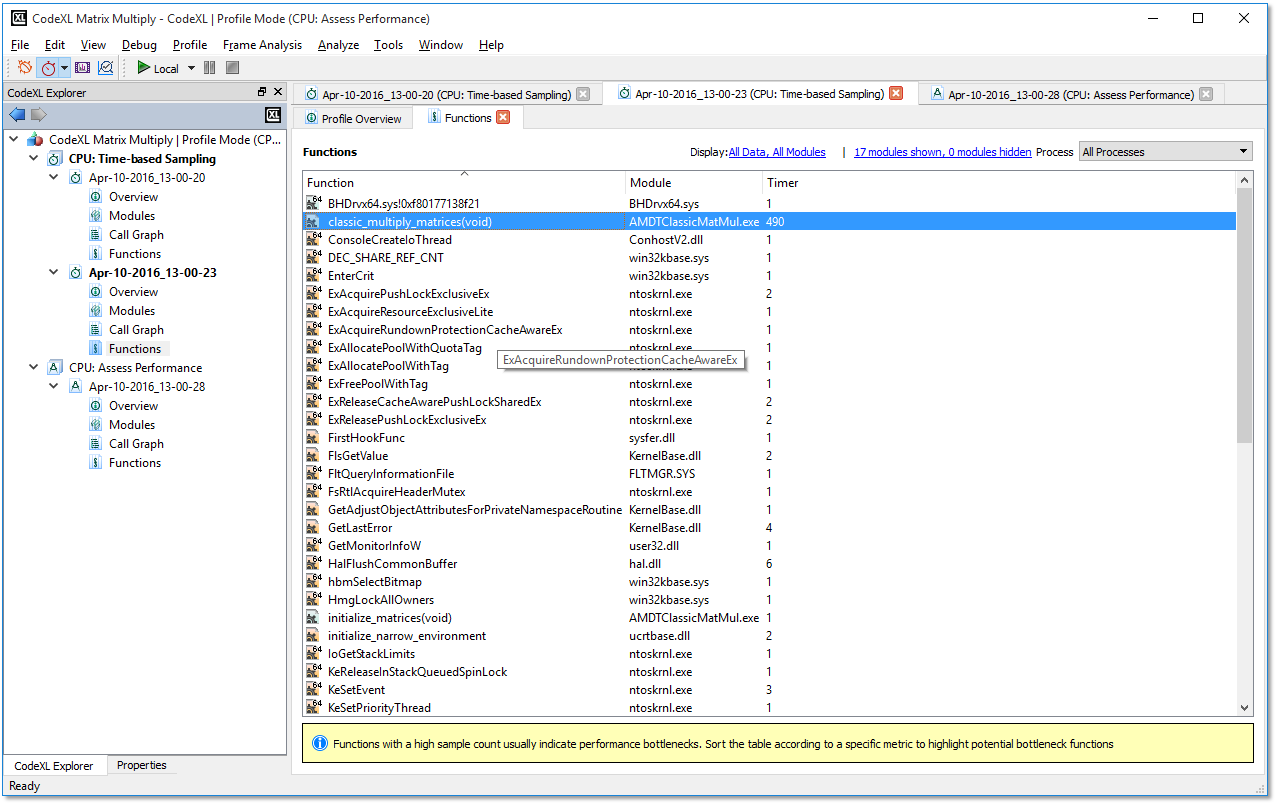
Function view displays list of functions called during profiling of the current session in a table.
Open Functions View
This view can be opened in any of the following ways.
· Double-click the Functions node of a session. It opens the functions view with Process selected as All Processes. If the view was already there, it just opens the view tab.

· Double-click the process table in the Profile Session Overview Page. This opens the Function view selecting that process. All the functions from that process are listed. This way of opening the Function view is possible only when multiple processes exist.
· Double-click the Module table in Profile Session Overview Page. This opens the Function view selecting only that module.
· Double-click the process table in Profile Session Modules View. This opens the Function view selecting that process.
· Double-click the Module table in Profile Session Modules View. This opens the Function view selecting only that module.
· Selecting the "Display in Functions View" option from context menu of any of the four tables of the Call Graph View. This opens the Function view selecting the function that was selected in Call Graph view on the current table.
Columns
This table shows two columns:
· Function ‒ Contains the name of the function, if available, or a NO_SYMBOL string if the function name could not be determined from the available symbol. There is an icon before each function name in this column indicating if the function is a system function or a function from a user module. It also indicates if the corresponding library is 32-bit or 64-bit.
· Module ‒ This column lists the corresponding module of the function. It lists the module name only, without path. Full path information is visible on the tooltips of the corresponding module.
Other optional columns are displayed only if the corresponding events are profiled and those columns are selected for display. For TBP, the only available variable column is timer. Multiple views are possible for EBP or IBS.
Each of the views has a corresponding list of selectable columns for display in the functions view. The combo-box at the beginning of Column section of Display Settings dialog lists the available views for the selected profile type of the current session.
Below the view combo-box is a list of checkboxes, each of which controls the visibility of a certain column. When the combo-box is checked, the corresponding column is visible; when the combo-box is unchecked, the corresponding column is hidden (see CodeXL CPU Profile Display Settings Dialog). For a full list of views and available columns, see the CodeXL CPU Profile Types section.
Filters
Functions table data can be filtered with one of the three options.
· Display Settings dialog ‒ This is opened from the hyperlink above the table, labeled Display. This dialog lets you select the view, the displayed column(s) from them. It also let you specify whether to display system modules, split the data based on core or NUMA nodes(splitting data based on NUMA nodes is available on Windows only), and display the absolute value of data or some percentage with a bar. (For details, see the CodeXL CPU Profile Display Settings Dialog.)

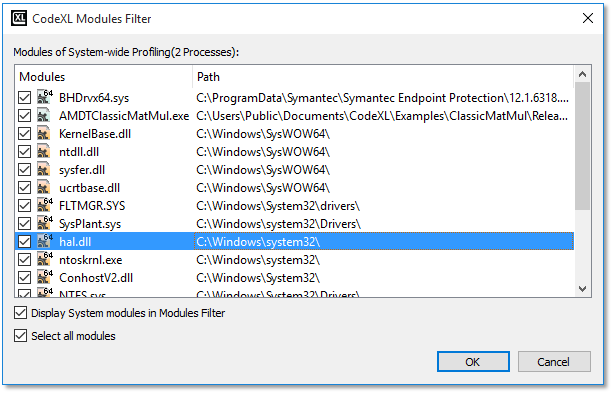
· Module Filter ‒ This is opened from the hyperlink above the table. It shows the number of visible and hidden modules. Clicking on this hyperlink opens the Module Filter dialog. It contains a table with two columns: Modules and Path. Modules column lists the modules name (the icons have the same meaning as described in the function table), and Path contains the path of that module. Both columns are sortable by clicking on the respective heading.

The following screenshot shows an example result after clicking the hyperlink shown in the red boundary above.
|
Modules |
This column contains one checkbox per cell which indicates whether to display functions of this module in functions view. There are two checkboxes below the table. The Select all modules checkbox is used to select/un-select all the modules currently displayed in the table. This checkbox is always enabled. The Display System modules in Modules Filter checkbox is enabled only if the Display system modules checkbox is checked (in the Display Settings dialog). When enabled, it shows / hides the system modules in the table. On selecting some modules in this table with the checkboxes and clicking the OK button, the functions view is updated. It shows the function only from selected modules, and the link above the table shows the updated count of shown and hidden modules. |
|
Processes |
Process combo-box lists all the processes in process-name (process-id) format. It also has one option called All Processes. If a process is selected in this combo-box, all the functions from that process are listed in the table. If All Processes is selected, all the functions from all the modules of the current session are displayed in the current table. |

Context Menu
The Function table provides a context menu. Open it by right clicking on the table. The context menu has four items separated into two groups. The following list describes each of the four items.

· Opening Source Code ‒ Opens the source code or disassembly view for the currently selected function in the function table.
· Display in Call Graph View ‒ Opens the Call Graph view for the currently selected function in the function table.
· Copy ‒ Copies the selected column(s) in the function table, along with the headers of the column in buffer, for pasting into another application such as Notepad, Microsoft word, Microsoft Excel, etc. See the common context menu section.
· Select All ‒ Selects all the rows and all the columns of the function table. See the common context menu section.