About working on a chart
From Microsoft Office PowerPoint 2003
You can create a chart from scratch in Microsoft PowerPoint, or you can import a Microsoft Excel worksheet or chart. The default charting program for PowerPoint is Microsoft Graph, and it is installed automatically with PowerPoint.
When you create a new chart in PowerPoint, Microsoft Graph opens and a chart is displayed with its associated data in a table called a datasheet. You can enter your own data on the datasheet, import data from a text file or Lotus 1-2-3 file, import or insert a Microsoft Excel worksheet or chart, or paste data from another program.
![]() Microsoft PowerPoint window
Microsoft PowerPoint window
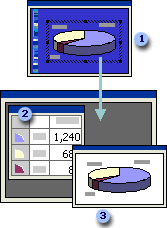
![]() Microsoft Graph window with datasheet
Microsoft Graph window with datasheet
![]() Microsoft Graph chart window
Microsoft Graph chart window
When you work on a chart, the Microsoft Graph program appears, with its own menus and buttons (or, if you have inserted an Excel chart, Excel menu and buttons appear, integrated with the PowerPoint menus) so that you can modify the chart. For example, you might want to change the chart type from pie to column, make the text larger, or add new colors. Information about how to modify charts is available from the Help menu on your menu bar while you are working on a chart.