About organization charts
You can use the diagramming tool on the Drawing toolbar to create an organization chart to illustrate hierarchical relationships, such as department managers and employees within a company.

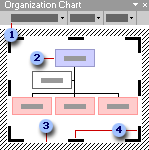
 Organization chart toolbar
 Organization chart
 Drawing border
 Drawing sizing handle
When you add or change an organization chart, the organization chart appears with drawing space around it, outlined by a non-printing border and sizing handles. You can size the organization chart by using sizing commands to make the drawing area larger so you have more room to work, or you can get rid of extra space by fitting the border more closely to the diagram.

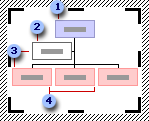
 Superior shape
 Assistant shape
 Subordinate shapes (assistant and employee of the superior shape)
 Coworker shapes (also a subordinate of the superior shape)
Format the entire organization with preset styles; or, format pieces of it like you format shapes
You can also animate the organization chart to direct focus to different pieces of the chart and control the flow of information during a presentation.
