12.8 Tracing Just in Time Connections
If issues still exist with your Just in Time deployment after reviewing the 12.7 Troubleshooting Just in Time, the next step is to configure tracing to obtain more detailed information.
To configure tracing:
|
Step |
How to do it |
|
1. Enable Tracing on the Client Application |
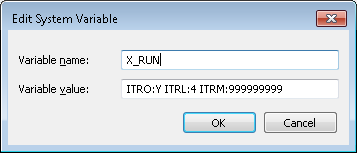
Add the following X_RUN commands to the X_LANSA.PRO or X_START start file: ITRO=Y ITRL=4 ITRM=999999 |
|
or |
|
|
Enable tracing globally |
Add the following X_RUN values to the system environment variables
|
|
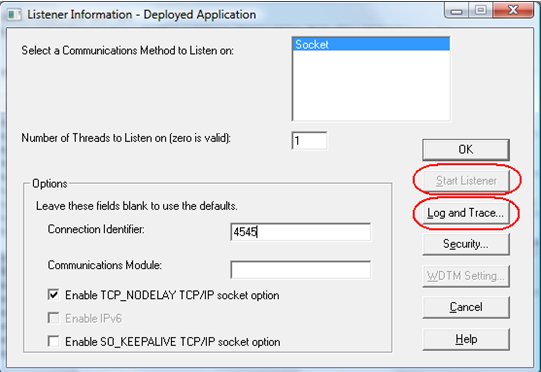
2. Enable Tracing on the Listener on the Application Server |
Click the Log and Trace button.
In the Trace panel, select the button and then click OK. Stop and re-start the Listener. Close the Communications Administrator. |
|
3. Retry the connection |
If the connection continues to fails, select No when prompted to continue. The Listener trace files can be located in the Connect directory on the JIT Application Server. Locate the log file x_lansa.trc. The Client Application trace files should be located in the X_LANSA directory or %temp% directory as x_tracennn.txt files. |
|
4. Contact LANSA Support |
Contact LANSA support and forward your trace files and any detailed information relevant to your Just in Time setup. |
|
5. Remove tracing |
Remove all tracing to avoid overheads when running the application. |

